Transferring Product Software (Base Code)
If the sending TI-89 or TI-92 Plus has its original product software (base code) or a free maintenance upgrade, the receiving TI-89 or TI-92 Plus does not need a new certificate. Its current certificate is valid, and the maintenance upgrade can be transferred.
If the sending TI-89 or TI-92 Plus has a purchased feature upgrade, the upgrade must be purchased for the receiving unit. A certificate can then be downloaded and installed on the receiving unit. After the certificate is installed, the feature upgrade can be transmitted.
You can see which version of product software is in your TI-89 / TI-92 Plus. From the Home screen, press F1 and select A:About.
Product software (base code) will transfer only from a TI-89 to a TI-89 or from a TI-92 Plus to a TI-92 Plus. You cannot send Advanced Mathematics 2.x product software (base code) to a TI-92 unless it contains a Plus module. For more calculator compatibility information, refer to page 380.
To transfer product software (base code) from unit to unit:
Important: For each receiving unit, remember to back up information as necessary and install new batteries.
- Link two units as described on page 366.
- On the receiving and the sending unit, press [2nd] [VAR-LINK] to display the VAR-LINK screen.
- On the receiving and the sending unit, press [F3] Link to display the menu options.
- On the receiving unit, select 5:Receive Product SW.
A warning message displays. Press [ESC] to halt the process, or press [ENTER] to proceed. Pressing [ENTER], displays VAR-LINK: WAITING TO RECEIVE and BUSY in the status line of the receiving unit.
Important: Be sure both the sending and receiving units are in the VAR-LINK screen.
- On the sending unit, select 4:Send Product SW.
A warning message displays. Press [ESC] to halt the process, or press [ENTER] to start the transmission.
Chapter 22: Linking and Upgrading 375
During the transfer, the receiving unit shows how the transfer is progressing. When the transfer is complete:
- The sending unit returns to the VAR-LINK screen.
- The receiving unit returns to the Home screen. You may need to use \blacklozenge (lighten) or \blacklozenge (darken) to adjust the contrast.
After the transfer starts, the receiving unit's existing base code is effectively deleted. If you interrupt the transfer before it is complete, the receiving unit will not operate properly. You will then need to reinstall the base code (maintenance or feature) upgrade via a computer.
To perform a maintenance upgrade on multiple units, you can transfer an upgrade from one unit to another instead of installing it on each unit via a computer. Maintenance upgrades are released free of charge and you do not need to obtain a certificate before you download or install them.
Before installing a purchased feature upgrade, each TI-89 or TI-92 Plus must have its own unique certificate. During download and installation, you can choose both the certificate and feature upgrade or only the certificate. The illustration below shows the most efficient way to prepare multiple units for a purchased feature upgrade.
Transferring Product Software (continued)
Do Not Attempt to Cancel a Product Software (Base Code) Transfer
If You're Upgrading Product Software (Base Code) on Multiple Units
Note: Group certificates are also available. See page 378.
Tip: Generally, transmitting a base code upgrade from unit-to-unit is much quicker than installing it via a computer.

From the computer, download and install the certificate and feature upgrade for one unit.
From the computer, download and install only the unique certificate for each of the other units.
Starting with the first unit, transfer the feature upgrade from one unit to another as described below.
Preparing multiple TI-92 Plus units for a purchased feature upgrade works the same as illustrated above.
376 Chapter 22: Linking and Upgrading
Error Messages
Most error messages are displayed on the sending unit. Depending on when the error occurs during the transfer process, you may see an error message on the receiving unit.
\begin{tabular}{|l|l|} \hline Error Message & Description \ \hline ERROR \newline Link transmission \newline \leftarrow ESC=CANCEL \rightarrow & The sending and receiving units are not connected properly, or the receiving unit is not set up to receive. \ \hline ERROR \newline Unlicensed product software or Flash application \newline \leftarrow Enter=OK \rightarrow \leftarrow ESC=CANCEL \rightarrow & The certificate on the receiving unit is not valid for the product software (base code) on the sending unit. You must obtain and install a valid certificate. \ \hline ERROR \newline Signature error \newline \leftarrow ESC=CANCEL \rightarrow & An error occurred during the transfer. The current product software in the receiving unit is corrupted. You must reinstall the product software from a computer. \ \hline ERROR \newline Batteries too low for sending/receiving product code \newline \leftarrow ESC=CANCEL \rightarrow & Replace the batteries on the unit displaying this message. \ \hline \end{tabular}
Chapter 22: Linking and Upgrading 377

Collecting and Transmitting ID Lists
The VAR-LINK screen F3 6:Send ID List menu option allows collection of electronic ID numbers from individual TI-89 / TI-92 Plus calculators.
I D Lists and Group Certificates
The ID list feature provides a convenient way to collect calculator IDs for group purchase of commercial applications. After the IDs are collected, transmit them to Texas Instruments so a group certificate can be issued.
A group certificate allows distribution of purchased software to multiple TI-89 / TI-92 Plus units. The software can be loaded, deleted from, and reloaded to the calculators as often as needed for as long as the software remains listed in the group certificate. You may add new ID numbers and/or new commercial applications to a group certificate.
Collecting ID Lists
You can use one calculator to collect all of the IDs, or use several collection units and then consolidate their ID lists onto one calculator.
To send an ID number from one calculator to another, first connect two units by using the calculator-to-calculator cable that came with the TI-89 / TI-92 Plus. Refer to the illustrations on page 366.
Note: You cannot view the ID list on the sending or collecting units.
\begin{tabular}{lll} \hline Step: & On the: & Do this: \ \hline
- & Collecting unit & Display the Home screen. Press: \ & (Receiving unit) & TI-89: [HOME] \ & & TI-92 Plus: \blacklozenge [HOME] \
- & Sending unit & a. Press 2nd[VAR-LINK] to display the VAR-LINK \ & & screen. \ & & b. Press F3 Link and select \ & & 6:Send ID List. \ & & \
- & Additional units & The sending unit adds a copy of its unique ID \ & & number to the collection unit's ID list. The \ & & sending unit always retains its own ID \ & & number, which cannot be deleted from the \ & & calculator. \ & & Repeat steps 1 and 2 until all the IDs are \ & & collected onto one calculator. \ & & Depending on available memory in the \ & & collection calculator, it is possible to collect \ & & over 4,000 IDs. \ \hline \end{tabular}
Note: Each time an ID list is successfully sent from one calculator to another, the ID list is automatically deleted from the sending unit.
Note: If an ID is collected from a calculator twice, the duplicate ID is automatically deleted from the list.
378 Chapter 22: Linking and Upgrading

Transmitting the ID List to a Computer
After all the IDs are collected onto one calculator, use the TI-GRAPH LINK™ software and a computer-to-calculator cable (available separately) to store the ID list on a computer. The ID list can then be sent as an e-mail attachment, or it can be printed and faxed or mailed to Texas Instruments.
For complete instructions on how to transmit an ID list from a TI-89 / TI-92 Plus to a computer, refer to the TI-GRAPH LINK guidebook. The general steps are:
- Connect the cable to the computer and to the calculator that contains the ID list.
- Start the TI-GRAPH LINK software on the computer.
- Display the Home screen on the calculator. Press: TI-89: [HOME] TI-92 Plus: [♦] [HOME]
- In the TI-GRAPH LINK software, select Get ID List from the Link menu.
- Select a directory on the computer in which to store the ID list and record this location for future reference.
- Click OK to store the ID list on the computer's hard drive.
The ID list remains on the collection calculator until you either clear it or send it to another TI-89 / TI-92 Plus.
Clearing the ID List
The ID list remains on the collection calculator after it is uploaded to the computer. You can then use the collection calculator to upload the list to other computers.
To clear the ID list from the collection unit:
- Press [2nd] [VAR-LINK] to display the VAR-LINK screen.
- Press [F1] Manage and select A:Clear ID List.

Chapter 22: Linking and Upgrading 379
Compatibility between a TI-89, TI-92 Plus, and TI-92
In general, TI-89 and TI-92 Plus data and programs are compatible, with some differences. However, both calculators have incompatibilities with the TI-92. Where possible, data transfer with a TI-92 is allowed.
Main Types of Incompatibilities
All data is compatible between a TI-89 and TI-92 Plus, but some programs written for one may not run the same on the other because of differences in the calculators’ screen sizes and keyboards.
Compared to a TI-92, the TI-89 and TI-92 Plus:
- Have functions, instructions, and system variables that do not exist on the TI-92.
- Can use the same variable to define and then evaluate a user-defined function or program. For example, you can define a function in terms of x and then evaluate that function using an expression containing x. This causes a Circular definition error on the TI-92. Refer to Chapter 17: Programming for more information.
- Manage local variables differently than the TI-92. Refer to Chapter 17: Programming for more information.
Text versus Tokenized
When you create a function or program in the Program Editor, it exists in text form until you run it. Then it is converted automatically to a tokenized form.
- Data in text form can always be shared between a TI-89, TI-92 Plus, and TI-92. However, the function or program may not give the same results when run on a different calculator.
- Data in tokenized form contains information that describes included functionality. The TI-89 and TI-92 Plus use the same tokenized forms, but the TI-92 is different.
- If you attempt to send a tokenized function, program, or other data type from a TI-89 or TI-92 Plus to a TI-92, the TI-89 or TI-92 Plus automatically checks to be sure the functionality is acceptable for the TI-92. If not, the data is not sent. This is for your protection because the tokenized data could cause the TI-92 to lock up if the data is sent with invalid functionality.
- Even if the tokenized data is sent, this does not guarantee that the data will give the same results on the other calculator.
Note: If you use the Program Editor to edit a function or program that is in tokenized form, it returns to text form until the next time you run it.
380 Chapter 22: Linking and Upgrading
TI-92 to TI-89 or TI-92 Plus
All user-defined variables, including functions and programs, can be sent from a TI-92 to a TI-89 or TI-92 Plus. However, they may behave differently. Examples are:
- Conflicts between TI-89 / TI-92 Plus system variable, function, and instruction names and TI-92 user-defined names.
- Programs or functions that use symbolic local variables. On a TI-89 and TI-92 Plus, a local variable must be initialized with a value before it can be referenced (meaning that a local variable cannot be used symbolically), or you must use a global variable instead. This includes programs that evaluate strings as local variables that are symbolic, such as
expr().
TI-89 or TI-92 Plus to TI-92
Any functionality that exists on a TI-89 or TI-92 Plus and NOT on a TI-92 will NOT run as expected on a TI-92. In some cases (text form), the data will transfer but may give an error when run on the TI-92. In other cases (tokenized form), the data may not be sent to the TI-92.
If the data contains only functionality available on a TI-92, it can probably be sent to and run on a TI-92 with the same results.
Exceptions include:
- Graph databases (GDBs) will not be sent because the TI-89 and TI-92 Plus use a GDB structure that has more information than the TI-92 GDB.
- A function or program defined in terms of a variable such as
xand then evaluated using some expression containing that same variable will run on a TI-89 and TI-92 Plus, but will cause a Circular definition error on a TI-92. - Some existing TI-92 functions and instructions have enhanced functionality on a TI-89 and TI-92 Plus (such as
NewData,setMode(), and matrix functions that use the optional tolerance argument). These functions and instructions may not be sent at all or may cause an error on a TI-92. - Archived variables will not be sent to a TI-92. Unarchive the variables first.
- Data variables that contain headers will not be sent. Those without headers will be sent only if the contents are TI-92 compatible.
- Product software (base code) upgrades.
- Flash applications.
You can upgrade a TI-92 to a TI-92 Plus by installing a TI-92 Plus Module. See the Texas Instruments web site education.ti.com for more information.
Chapter 22: Linking and Upgrading 381
382 Chapter 22: Linking and Upgrading
Activities
23
- Analyzing the Pole-Corner Problem ........ 384
- Deriving the Quadratic Formula ........ 386
- Exploring a Matrix ........ 388
- Exploring cos(x) = sin(x) ........ 389
- Finding Minimum Surface Area of a Parallelepiped ........ 390
- Running a Tutorial Script Using the Text Editor ........ 392
- Decomposing a Rational Function ........ 394
- Studying Statistics: Filtering Data by Categories ........ 396
- CBL 2/CBL Program for the TI-89 / TI-92 Plus ........ 399
- Studying the Flight of a Hit Baseball ........ 400
- Visualizing Complex Zeros of a Cubic Polynomial ........ 402
- Solving a Standard Annuity Problem ........ 404
- Computing the Time-Value-of-Money ........ 405
- Finding Rational, Real, and Complex Factors ........ 406
- Simulation of Sampling without Replacement ........ 407
This chapter contains activities that show how the TI-89 / TI-92 Plus can be used to solve, analyze, and visualize actual mathematical problems.

Chapter 23: Activities 383


Analyzing the Pole-Corner Problem
A ten-foot-wide hallway meets a five-foot-wide hallway in the corner of a building. Find the maximum length pole that can be moved around the corner without tilting the pole.
Maximum Length of Pole in Hallway
The maximum length of a pole c is the shortest line segment touching the interior corner and opposite sides of the two hallways as shown in the diagram below.
Hint: Use proportional sides and the Pythagorean theorem to find the length c with respect to w. Then find the zeros of the first derivative of c(w). The minimum value of c(w) is the maximum length of the pole.

Tip: When you want to define a function, use multiple character names as you build the definition.
- Define the expression for side a in terms of w and store it in a(w).
- Define the expression for side b in terms of w and store it in b(w).
- Define the expression for side c in terms of w and store it in c(w) Enter: Define c(w)= \sqrt(a(w)^2+b(w)^2)
Note: The maximum length of the pole is the minimum value of c(w).
- Use the zeros() function to compute the zeros of the first derivative of c(w) to find the minimum value of c(w).
384 Chapter 23: Activities


- Compute the exact maximum length of the pole. Enter: c((2nd [ANS])

Hint: Use the auto-paste feature to copy the result from step 4 to the entry line inside the parentheses of c( ) and press [■] [ENTER].
- Compute the approximate maximum length of the pole. Result: Approximately 20.8097 feet.
Chapter 23: Activities 385
Deriving the Quadratic Formula
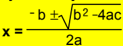
This activity shows you how to derive the quadratic formula: $x = \frac-b ± \sqrtb^2 - 4ac2a$ Detailed information about using the functions in this example can be found in Chapter 3: Symbolic Manipulation.
Performing Computations to Derive the Quadratic Formula
Perform the following steps to derive the quadratic formula by completing the square of the generalized quadratic equation.
-
Clear all one-character variables in the current folder. TI-89: [2nd] [F6] TI-92 Plus: [F6] Choose 1:Clear a-z and press [ENTER] to confirm.
-
On the Home screen, enter the generalized quadratic equation: $ax^2 + bx + c = 0$.
Note: This example uses the result of the last answer to perform computations on the TI-89 / TI-92 Plus. This feature reduces keystroking and chances for error.
- Subtract c from both sides of the equation.
TI-89: [2nd] [ANS] [alpha] C
TI-92 Plus: [2nd] [ANS] C
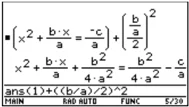
Tip: Continue to use the last answer ([2nd] [ANS]) as in step 3 in steps 4 through 9.
-
Divide both sides of the equation by the leading coefficient a.
-
Use the expand() function to expand the result of the last answer.
-
Complete the square by adding $((b/a)/2)^2$ to both sides of the equation.
386 Chapter 23: Activities
-
Factor the result using the factor() function.
-
Multiply both sides of the equation by 4a².
-
Take the square root of both sides of the equation with the constraint that a>0 and b>0 and x>0.
-
Solve for x by subtracting b from both sides and then dividing by 2a.
Note: This is only one of the two general quadratic solutions due to the constraint in step 9.
factor(ans(1)) MAIN RAD AUTO FUNC 6/30
4a^2*ans(1) MAIN RAD AUTO FUNC 7/30
(1)|a>0 and b>0 and x>0 MAIN RAD AUTO FUNC 8/30
ans(1)-b MAIN RAD AUTO FUNC 9/30
ans(1)/(2a) MAIN RAD AUTO FUNC 10/30
Chapter 23: Activities 387

Exploring a Matrix
This activity shows you how to perform several matrix operations.
Exploring a 3x3 Matrix
Perform these steps to generate a random matrix, augment and find the identity matrix, and then solve to find an invalid value of the inverse.
-
On the Home screen, use RandSeed to set the random number generator seed to the factory default, and then use randMat() to create a random 3x3 matrix and store it in a.
-
Replace the [2,3] element of the matrix with the variable x, and then use the augment() function, to augment the 3x3 identity to a and store the result in b.
Tip: Use the cursor in the history area to scroll the result.
- Use rref() to "row reduce" matrix b:
The result will have the identity matrix in the first three columns and $a^{-1}$ in the last three columns.
Tip: Use the cursor in the history area to scroll the result.
- Solve for the value of x that will cause the inverse of the matrix to be invalid.
Enter: solve(getDenom( \underline2nd [ANS][1,4])=0,x)
Result: x= - 70/17

388 Chapter 23: Activities


Exploring cos(x) = sin(x)
This activity uses two methods to find where cos(x) = sin(x) for the values of x between 0 and 3\pi.
Method 1: Graph Plot
Perform the following steps to observe where the graphs of the functions y1(x)=cos(x) and y2(x)=sin(x) intersect.
- In the Y= Editor, set y1(x)=cos(x) and 2(x)=sin(x).
- In the Window Editor, set xmin=0 and xmax=3\pi.
- Press F2 and select A:ZoomFit.
- Find the intersection point of the two functions.
- Note the x and y coordinates. (Repeat steps 4 and 5 to find the other intersections.)
Hint: Press F5 and select 5:Intersection. Respond to the screen prompts to select the two curves, and the lower and upper bounds for intersection A.
Method 2: Symbolic Manipulation
Perform the following steps to solve the equation sin(x)=cos(x) with respect to x.
- On the Home screen, enter solve(sin(x)= cos(x),x).
The solution for x is where @n1 is any integer.
Hint: Move the cursor into the history area to highlight the last answer. Press ENTER to copy the result of the general solution.
- Using the ceiling() and floor() functions, find the ceiling and floor values for the intersection points as shown.
Hint: To get the "with" operator: TI-89: [ ] TI-92 Plus: [2nd] [']
- Enter the general solution for x and apply the constraint for @n1 as shown.
Compare the result with Method 1.
Chapter 23: Activities 389


Finding Minimum Surface Area of a Parallelepiped
This activity shows you how to find the minimum surface area of a parallelepiped having a constant volume V. Detailed information about the steps used in this example can be found in Chapter 3: Symbolic Manipulation and Chapter 10: 3D Graphing.
Exploring a 3D Graph of the Surface Area of a Parallelepiped
Perform the following steps to define a function for the surface area of a parallelepiped, draw a 3D graph, and use the Trace tool to find a point close to the minimum surface area.
-
On the Home screen, define the function sa(x,y,v) for the surface area of a parallelepiped.
Enter: define sa(x,y,v)=2* x* y+ 2v/x+2v/y
-
Select the 3D Graph mode. Then enter the function for z1(x,y) as shown in this example with volume v=300.
-
Set the Window variables to: eye= [60,90,0] x= [0,15,15] y= [0,15,15] z= [260,300] ncontour= [5]

- Graph the function and use Trace to go to the point close to the minimum value of the surface area function.
390 Chapter 23: Activities


Finding the Minimum Surface Area Analytically
Perform the following steps to solve the problem analytically on the Home screen.
- Solve for x and y in terms of v.
Enter:
solve(d(sa(x,y,v),x)=0 and d(sa(x,y,v),y)=0,{x,y})
 ■ Define sa(x, y, v) = 2·x·y
Done
■ solve( { ∂/∂x(sa(x, y, v)) = 0
d(sa(x,y,v),x)=0, {x,y} } )
x = v^(1/3) and y = v^(1/3)
Home AUTO FUNC 27:8
-
Find the minimum surface area when the value of v equals 300. Enter: 300 → v Enter: sa(v^(1/3), v^(1/3), v)
■ 300 → v 300 ■ sa(v^(1/3), v^(1/3), v) 60·10^(1/3)·3^(2/3) ■ sa(v^(1/3), v^(1/3), v) 268.884 ■ sa(v^(1/3), v^(1/3), v) Home AUTO 30 6/30
Hint: Press [ENTER] to obtain the exact result in symbolic form. Press [♦] [ENTER] to obtain the approximate result in decimal form.
Chapter 23: Activities 391
Running a Tutorial Script Using the Text Editor
This activity shows you how to use the Text Editor to run a tutorial script. Detailed information about text operations can be found in Chapter 18: Text Editor.
Running a Tutorial Script
Perform the following steps to write a script using the Text Editor, test each line, and observe the results in the history area on the Home screen.
- Open the Text Editor, and create a new variable named demo1.
Note: The command symbol "C" is accessed from the F2 1:Command toolbar menu.
-
Type the following lines into the Text Editor.
: Compute the maximum value of f on the closed interval [a,b] : assume that f is differentiable on [a,b] C: define f(x)=x^3- 2x^2+x- 7 C: 1⇒a:3.22⇒b C: d(f(x),x)⇒df(x) C: zeros(df(x),x) C: f(ans(1)) C: f((a,b)) : The largest number from the previous two commands is the maximum value of the function. The smallest number is the minimum value.
-
Press F3 and select 1:Script view to show the Text Editor and the Home screen on a split-screen. Move the cursor to the first line in the Text Editor.
392 Chapter 23: Activities


Note: Press F3 and select 2:Clear split to go back to a full-sized Text Editor screen.
- Press F4 repeatedly to execute each line in the script one at a time.

Tip: Press 2nd [QUIT] twice to display the Home screen.
- To see the results of the script on a full-sized screen, go to the Home screen.
Chapter 23: Activities 393
Decomposing a Rational Function
This activity examines what happens when a rational function is decomposed into a quotient and remainder. Detailed information about the steps used in this example can be found in Chapter 6: Basic Function Graphing and Chapter 3: Symbolic Manipulation.
Decomposing a Rational Function
Note: Actual entries are displayed in reverse type in the example screens.
To examine the decomposition of the rational function f(x)=(x³ – 10x² – x+50)/(x– 2) on a graph:
- On the Home screen, enter the rational function as shown below and store it in a function f(x). Enter: (x^3- 10x^2- x+50)/ (x- 2)→f(x)

- Use the proper fraction function (propFrac) to split the function into a quotient and remainder.

- Copy the last answer to the entry line. —or— Enter: 16/(x- 2)+x^2- 8* x- 17
Hint: Move the cursor into the history area to highlight the last answer. Press [ENTER] to copy it to the entry line.
-
Edit the last answer in the entry line. Store the remainder to y1(x) and the quotient to y2(x) as shown. Enter: 16/(x- 2)→y1(x): x^2- 8* x- 17→y2(x)
-
In the Y= Editor, select the thick graphing style for y2(x).
394 Chapter 23: Activities
-
Add the original function f(x) to y3(x) and select the square graphing style.
-
In the Window Editor, set the window variables to: x= [-10,15,10] y= [-100,100,10]
Note: Be sure the Graph mode is set to Function.
- Draw the graph.
Observe that the global behavior of the f(x) function is basically represented by the quadratic quotient y2(x). The rational expression is basically a quadratic function as x gets very large in both the positive and negative directions.
The lower graph is y3(x)=f(x) graphed separately using the line style.

Chapter 23: Activities 395

Studying Statistics: Filtering Data by Categories
This activity provides a statistical study of the weights of high school students using categories to filter the data. Detailed information about using the commands in this example can be found in Chapter 15: Data/Matrix Editor, and Chapter 16: Statistics and Data Plots.
Filtering Data by Categories
Each student is placed into one of eight categories depending on the student's sex and academic year (freshman, sophomore, junior, or senior). The data (weight in pounds) and respective categories are entered in the Data/Matrix Editor.
Table 1: Category vs. Description \begin{tabular}{|c|l|} \hline Category (C2) & Academic Year and Sex \ \hline 1 & Freshman boys \ 2 & Freshman girls \ 3 & Sophomore boys \ 4 & Sophomore girls \ 5 & Junior boys \ 6 & Junior girls \ 7 & Senior boys \ 8 & Senior girls \ \hline \end{tabular}
Table 2: C1 (weight of each student in pounds) vs. C2 (category) \begin{tabular}{|c|c|c|c|c|c|c|c|} \hline C1 & C2 & C1 & C2 & C1 & C2 & C1 & C2 \ \hline 110 & 1 & 115 & 3 & 130 & 5 & 145 & 7 \ 125 & 1 & 135 & 3 & 145 & 5 & 160 & 7 \ 105 & 1 & 110 & 3 & 140 & 5 & 165 & 7 \ 120 & 1 & 130 & 3 & 145 & 5 & 170 & 7 \ 140 & 1 & 150 & 3 & 165 & 5 & 190 & 7 \ 85 & 2 & 90 & 4 & 100 & 6 & 110 & 8 \ 80 & 2 & 95 & 4 & 105 & 6 & 115 & 8 \ 90 & 2 & 85 & 4 & 115 & 6 & 125 & 8 \ 80 & 2 & 100 & 4 & 110 & 6 & 120 & 8 \ 95 & 2 & 95 & 4 & 120 & 6 & 125 & 8 \ \hline \end{tabular}
396 Chapter 23: Activities
Perform the following steps to compare the weight of high school students to their year in school.
-
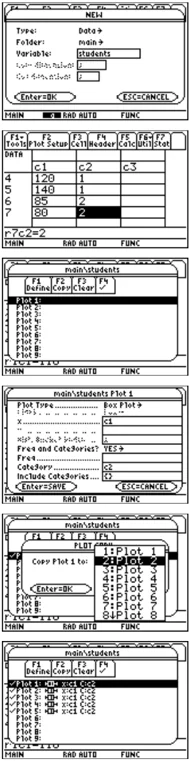
Start the Data/Matrix Editor, and create a new Data variable named students.
-
Enter the data and categories from Table 2 into columns c1 and c2, respectively.
Note: Set up several box plots to compare different subsets of the entire data set.
-
Open the F2 Plot Setup toolbar menu.
-
Define the plot and filter parameters for Plot 1 as shown in this screen.
-
Copy Plot 1 to Plot 2.
-
Repeat step 5 and copy Plot 1 to Plot 3, Plot 4, and Plot 5.
Chapter 23: Activities 397
- Press \boxedF1, and modify the Include Categories item for Plot 2 through Plot 5 to the following:
Plot 2: {1,2} (freshman boys, girls)
Plot 3: {7,8} (senior boys, girls)
Plot 4: {1,3,5,7} (all boys)
Plot 5: {2,4,6,8} (all girls)

Note: Only Plot 1 through Plot 5 should be selected.
-
In the Y= Editor, deselect any functions that may be selected from a previous activity.
-
Display the plots by pressing \boxedF2 and selecting 9:Zoomdata.
-
Use the Trace tool to compare the median student weights for different subsets.
all students all freshmen all seniors all boys all girls
median, all students
398 Chapter 23: Activities
CBL 2/CBL Program for the TI-89 / TI-92 Plus
This activity provides a program that can be used when the TI-89 / TI-92 Plus is connected to a Calculator-Based Laboratory™ (CBL 2™/CBL™) unit. This program works with the “Newton’s Law of Cooling” experiment, and is similar to the “Coffee To Go” experiment in the CBL System Experiment Workbook. You can use your computer keyboard to type lengthy text and then use TI-GRAPH LINK to send it to the TI-89 / TI-92 Plus. More TI-89 / TI-92 Plus CBL 2/CBL programs are available from the TI web site at: education.ti.com/cbl
| Program Instruction | Description |
|---|---|
| :cooltemp() | Program name |
| :Prgm | |
| :Local i | Declare local variable; exists only at run time. |
| :setMode("Graph","FUNCTION") | Set up the TI-89 / TI-92 Plus for function graphing. |
| :PlotsOff | Turn off any previous plots. |
| :FnOff | Turn off any previous functions. |
| :ClrDraw | Clear any items previously drawn on graph screens. |
| :ClrGraph | Clear any previous graphs. |
| :ClrIO | Clear the TI-89 / TI-92 Plus Program IO (input/output) screen. |
| :-10→xmin:99→xmax:10→xscl | Set up the Window variables. |
| :-20→ymin:100→ymax:10→yscl | |
| :{0}→data | Create and/or clear a list named data. |
| :{0}→time | Create and/or clear a list named time. |
| :Send{1,0} | Send a command to clear the CBL 2/CBL unit. |
| :Send{1,2,1} | Set up Chan. 2 of the CBL 2/CBL to AutoID to record temp. |
| :Disp "Press ENTER to start" | Prompt the user to press ENTER. |
| :Disp "graphingTemperature." | |
| :Pause | Wait until the user is ready to start. |
| :PtText "TEMP(C)",2,99 | Label the y axis of the graph. |
| :PtText "T(S)",80,-5 | Label the x axis of the graph. |
| :Send{3,1,-1,0} | Send the Trigger command to the CBL 2/CBL; collect data in real-time. |
| : | |
| :For i,1,99 | Repeat next two instructions for 99 temperature readings. |
| :Get data[i] | Get a temperature from the CBL 2/CBL and store it in a list. |
| :PtOn i,data[i] | Plot the temperature data on a graph. |
| :EndFor | |
| :seq(i,i,1,99,1)→time | Create a list to represent time or data sample number. |
| :NewPlot 1,1,time,data,,,,4 | Plot time and data using NewPlot and the Trace tool. |
| :DispG | Display the graph. |
| :PtText "TEMP(C)",2,99 | Re-label the axes. |
| :PtText "T(S)",80,-5 | |
| :EndPrgm | Stop the program. |
You can also use the Calculator-Based Ranger™ (CBR™) to explore the mathematical and scientific relationships between distance, velocity, acceleration, and time using data collected from activities you perform.
Chapter 23: Activities 399