Other Modes that Affect a Split Screen
| Mode | Description |
|---|---|
| Number of Graphs | Lets you set up and display two independent sets of graphs. |
| Note: Leave this set to 1 unless you have read the applicable section in Chapter 12. | This is an advanced graphing feature as described in “Using the Two-Graph Mode” in Chapter 12. |
Split Screens and Pixel Coordinates
The TI-89 / TI-92 Plus has commands that use pixel coordinates to draw lines, circles, etc., on the Graph screen. The following charts show how the Split Screen and Split Screen Ratio mode settings affect the number of pixels available on the Graph screen.
TI-89:
| Split | Ratio | Split 1 App x | Split 1 App y | Split 2 App x | Split 2 App y |
|---|---|---|---|---|---|
| FULL | N/A | 0 – 158 | 0 – 76 | N/A | N/A |
| TOP–BOTTOM | 1:1 | 0 – 154 | 0 – 34 | 0 – 154 | 0 – 34 |
| LEFT–RIGHT | 1:1 | 0 – 76 | 0 – 72 | 0 – 76 | 0 – 72 |
TI-92 Plus:
| Split | Ratio | Split 1 App x | Split 1 App y | Split 2 App x | Split 2 App y |
|---|---|---|---|---|---|
| FULL | N/A | 0 – 238 | 0 –102 | N/A | N/A |
| TOP–BOTTOM | 1:1 | 0 – 234 | 0 – 46 | 0 – 234 | 0 – 46 |
| 1:2 | 0 – 234 | 0 – 26 | 0 – 234 | 0 – 68 | |
| 2:1 | 0 – 234 | 0 – 68 | 0 – 234 | 0 – 26 | |
| LEFT–RIGHT | 1:1 | 0 – 116 | 0 – 98 | 0 –116 | 0 – 98 |
| 1:2 | 0 – 76 | 0 – 98 | 0 – 156 | 0 – 98 | |
| 2:1 | 0 – 156 | 0 – 98 | 0 – 76 | 0 – 98 |
Tip: For a list of drawing commands, refer to “Drawing on the Graph Screen” in Chapter 17.
Note: Due to the border that indicates the active application, split screens have a smaller displayable area than a full screen.
Exiting the Split Screen Mode
Method 1: Press [MODE] to display the MODE dialog box. Then set Split Screen = FULL. When you press [ENTER] to close the dialog box, the full-sized screen shows the application specified in Split 1 App.
Method 2: Press [2nd] [QUIT] twice to display a full-sized Home screen.
When You Turn Off the TI-89 / TI-92 Plus
Turning the TI-89 / TI-92 Plus off does not exit the split screen mode.
| If the calculator is turned off: | When you turn the calculator on again: |
|---|---|
When you press [2nd] [OFF] |
The split screen is still in effect, but the Home screen is always displayed in place of the application that was active when you pressed [2nd] [OFF]. |
By the Automatic Power Down™ (APD™) feature, or when you press [♦] [OFF]. |
The split screen is just as you left it. |
234 Chapter 14: Split Screens
Selecting the Active Application
With a split screen, only one of the two applications can be active at a time. You can easily switch between existing applications, or you can open a different application.
The Active Application
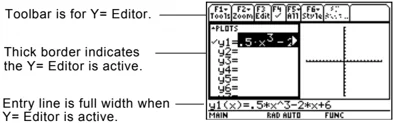
- The active application is indicated by a thick border.
- The toolbar and status line, which are always the full width of the display, are associated with the active application.
- For applications that have an entry line (such as the Home screen and Y= Editor), the entry line is the full width of the display only when that application is active.
Toolbar is for Y= Editor.
Thick border indicates the Y= Editor is active.
Entry line is full width when Y= Editor is active.
Switching between Applications
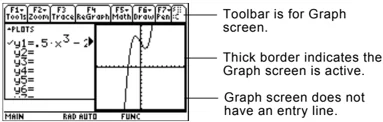
Press [2nd] [\square] (second function of [APPS]) to switch from one application to the other.
Tool bar is for Graph screen.
Thick border indicates the Graph screen is active.
Graph screen does not have an entry line.
Opening a Different Application
Method 1:
- Use [2nd] [\square] to switch to the application you want to replace.
- Use [APPS] or \blacklozenge (such as \blacklozenge [WINDOW]) to select the new application.
If you select an application that is already displayed, the TI-89 / TI-92 Plus switches to that application.
Method 2:
- Press [MODE] and then [F2].
- Change Split 1 App and/or Split 2 App.
If you set Split 1 App and Split 2 App to the same application, the TI-89 / TI-92 Plus exits the split screen mode and displays the application full screen.
Note: Also refer to "Using [2nd] [QUIT] to Display the Home Screen" on page 236.
Note: In two-graph mode, described in Chapter 12, the same application can be in both parts of a split screen.
Chapter 14: Split Screens 235
Using [2nd] [QUIT] to Display the Home Screen
Tip: Pressing [2nd] [QUIT] twice always exits the split screen mode.
When Using a Top-Bottom Split
Note: Both Top-Bottom and Left-Right splits use the same methods to select an application.
| If the Home screen: | Pressing [2nd] [QUIT]: |
|---|---|
| Is not already displayed | Opens the Home screen in place of the active application. |
| Is displayed, but is not the active application | Switches to the Home screen and makes it the active application. |
| Is the active application | Exits the split screen mode and displays a full-sized Home screen. |
When you select a TOP-BOTTOM split, remember that the entry line and the toolbar are always associated with the active application. For example:
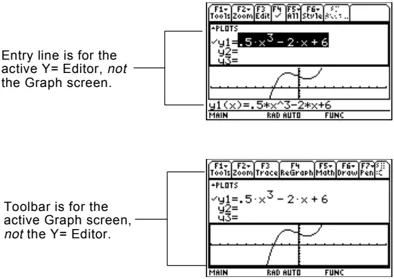
Entry line is for the active Y= Editor, not the Graph screen.
Toolbar is for the active Graph screen, not the Y= Editor.
236 Chapter 14: Split Screens
Data/Matrix Editor
15
- Preview of the Data/Matrix Editor ........ 238
- Overview of List, Data, and Matrix Variables ........ 239
- Starting a Data/Matrix Editor Session ........ 241
- Entering and Viewing Cell Values ........ 243
- Inserting and Deleting a Row, Column, or Cell ........ 246
- Defining a Column Header with an Expression ........ 248
- Using Shift and CumSum Functions in a Column Header ........ 250
- Sorting Columns ........ 251
- Saving a Copy of a List, Data, or Matrix Variable ........ 252
The Data/Matrix Editor serves two main purposes.
- This chapter describes how to use the Data/Matrix Editor to create and maintain a list, matrix, or data variable.

- Chapter 16 describes how to use the Data/Matrix Editor to perform statistical calculations and graph statistical plots.
Chapter 15: Data/Matrix Editor 237

Preview of the Data/Matrix Editor
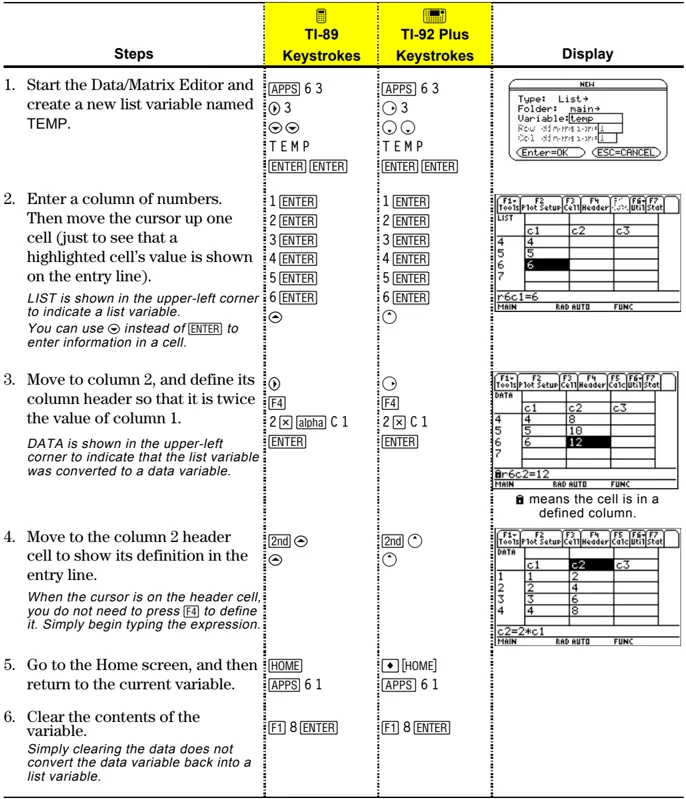
Use the Data/Matrix Editor to create a one-column list variable. Then add a second column of information. Notice that the list variable (which can have only one column) is automatically converted into a data variable (which can have multiple columns).
| Steps | TI-89 Keystrokes | TI-92 Plus Keystrokes | Display |
|---|---|---|---|
| 1. Start the Data/Matrix Editor and create a new list variable named TEMP. | [APPS] 6 3▽ 3▽ ▽T E M P[ENTER] [ENTER] | [APPS] 6 3▽ 3▽ ▽T E M P[ENTER] [ENTER] | |
| 2. Enter a column of numbers. Then move the cursor up one cell (just to see that a highlighted cell’s value is shown on the entry line).LIST is shown in the upper-left corner to indicate a list variable.You can use ▷ instead of [ENTER] to enter information in a cell. | 1 [ENTER]2 [ENTER]3 [ENTER]4 [ENTER]5 [ENTER]6 [ENTER]△ | 1 [ENTER]2 [ENTER]3 [ENTER]4 [ENTER]5 [ENTER]6 [ENTER]△ | |
| 3. Move to column 2, and define its column header so that it is twice the value of column 1.DATA is shown in the upper-left corner to indicate that the list variable was converted to a data variable. | ▷[F4]2 × [alpha] C 1[ENTER] | ▷[F4]2 × C 1[ENTER] | |
| 4. Move to the column 2 header cell to show its definition in the entry line.When the cursor is on the header cell, you do not need to press [F4] to define it. Simply begin typing the expression. | [2nd] ▷△ | [2nd] ▷△ | |
| 5. Go to the Home screen, and then return to the current variable. | [HOME][APPS] 6 1 | ◆ [HOME][APPS] 6 1 | |
| 6. Clear the contents of the variable.Simply clearing the data does not convert the data variable back into a list variable. | [F1] 8 [ENTER] | [F1] 8 [ENTER] |
Tip: If you don’t need to save the current variable, use it as a scratchpad. The next time you need a variable for temporary data, clear the current variable and re-use it. This lets you enter temporary data without creating a new variable each time, which uses up memory.
238 Chapter 15: Data/Matrix Editor
Overview of List, Data, and Matrix Variables
To use the Data/Matrix Editor effectively, you must understand list, data, and matrix variables.
List Variable
A list is a series of items (numbers, expressions, or character strings) that may or may not be related. Each item is called an element. In the Data/Matrix Editor, a list variable:
- Is shown as a single column of elements, each in a separate cell.
- Must be continuous; blank or empty cells are not allowed within the list.
- Can have up to 999 elements.
Note: If you enter more than one column of elements in a list variable, it is converted automatically into a data variable.
Tip: After creating a list in the Data/Matrix Editor, you can use the list in any application (such as the Home screen).
On the Home screen (or anywhere else you can use a list), you can enter a list as a series of elements enclosed in braces { } and separated by commas.
Although you must use commas to separate elements on the entry line, spaces separate the elements in the history area.
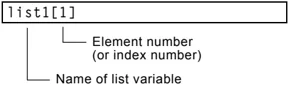
To refer to a specified element in a list, use the format shown to the right.
Data Variable
A data variable is essentially a collection of lists that may or may not be related. In the Data/Matrix Editor, a data variable:
- Can have up to 99 columns.
- Can have up to 999 elements in each column. Depending on the kind of data, all columns may not have to be the same length.
- Must have continuous columns; blank or empty cells are not allowed within a column.
Note: For stat calculations, columns must have the same length.
Chapter 15: Data/Matrix Editor 239
Data Variable
(Continued)
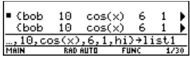
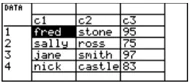
From the Home screen or a program, you can use the NewData command to create a data variable that consists of existing lists.
Although you cannot directly display a data variable on the Home screen, you can display a specified column or element.
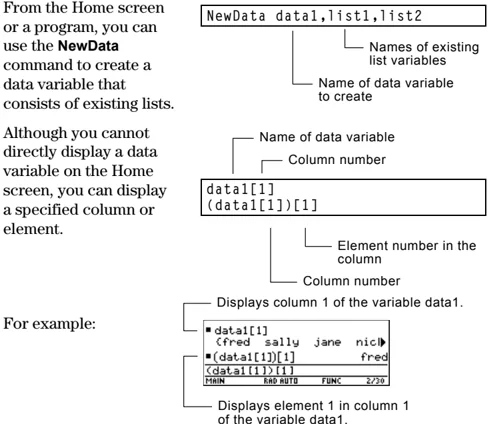
For example:
Displays column 1 of the variable data1.
Displays element 1 in column 1 of the variable data1.
Matrix Variable
A matrix is a rectangular array of elements. When you create a matrix in the Data/Matrix Editor, you must specify the number of rows and columns (although you can add or delete rows and columns later). In the Data/Matrix Editor, a matrix variable:
- Looks similar to a data variable, but all columns must have the same length.
- Is initially created with 0 in each cell. You can then enter the applicable value in place of 0.
Tip: After creating a matrix in the Data/Matrix Editor, you can use the matrix in any application (such as the Home screen).
Note: Use brackets to refer to a specific element in a matrix. For example, enter mat1[2,1] to access the 1st element in the 2nd row.
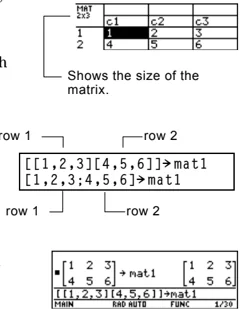
Shows the size of the matrix.
From the Home screen or a program, you can use \boxedSTO\blacktriangleright to store a matrix with either of the equivalent methods shown to the right.
Although you enter the matrix as shown above, it is pretty printed in the history area in traditional matrix form.
row 1 row 2
240 Chapter 15: Data/Matrix Editor
Starting a Data/Matrix Editor Session
Each time you start the Data/Matrix Editor, you can create a new variable, resume using the current variable (the variable that was displayed the last time you used the Data/Matrix Editor), or open an existing variable.
Creating a New Data, Matrix, or List Variable
- Press \boxedAPPS and then select 6:Data/Matrix Editor.
- Select 3:New.
- Specify the applicable information for the new variable.
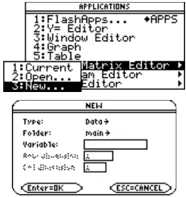
| Item | Lets you: |
|---|---|
| Type | Select the type of variable to create. Press \boxedD to display a menu of available types. |
| Folder | Select the folder in which the new variable will be stored. Press \boxedD to display a menu of existing folders. For information about folders, refer to Chapter 5. |
| Variable | Type a new variable name. |
| Note: If you do not type a variable name, the TI-89 / TI-92 Plus will display the Home screen. | If you specify a variable that already exists, an error message will be displayed when you press \boxedENTER. When you press \boxedESC or \boxedENTER to acknowledge the error, the NEW dialog box is redisplayed. |
| Row dimension and Col dimension | If Type = Matrix, type the number of rows and columns in the matrix. |

- Press \boxedENTER (after typing in an input box such as Variable, press \boxedENTER twice) to create and display an empty variable in the Data/Matrix Editor.
Chapter 15: Data/Matrix Editor 241
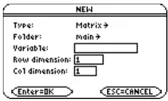
Using the Current Variable
You can leave the Data/Matrix Editor and go to another application at any time. To return to the variable that was displayed when you left the Data/Matrix Editor, press [APPS] 6 and select 1:Current.
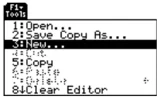
Creating a New Variable from the Data/Matrix Editor
From the Data/Matrix Editor:
- Press [F1] and select 3:New.
- Specify the type, folder, and variable name. For a matrix, also specify the number of rows and columns.
Opening Another Variable
You can open another variable at any time.
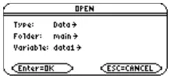
- From the Data/Matrix Editor, press [F1] and select 1:Open. — or — From any application, press [APPS] 6 and select 2:Open.
Note: Variable shows the first existing variable in alphabetic order. If there are no existing variables, nothing is displayed.
- Select the type, folder, and variable to open.
- Press [ENTER].
Note about Deleting a Variable
Because all Data/Matrix Editor variables are saved automatically, you can accumulate quite a few variables, which take up memory.
To delete a variable, use the VAR-LINK screen ([2nd][VAR-LINK]). For information about VAR-LINK, refer to Chapter 21.
242 Chapter 15: Data/Matrix Editor
Entering and Viewing Cell Values
If you create a new variable, the Data/Matrix Editor is initially blank (for a list or data variable) or filled with zeros (for a matrix). If you open an existing variable, the values in that variable are displayed. You can then enter additional values or edit the existing ones.
The Data/Matrix Editor Screen
A blank Data/Matrix Editor screen is shown below. When the screen is displayed initially, the cursor highlights the cell at row 1, column 1.
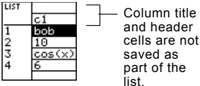
Tip: Use the title cell at the very top of each column to identify the information in that column.
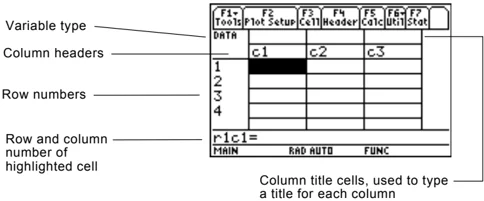
When values are entered, the entry line shows the full value of the highlighted cell.
Entering or Editing a Value in a Cell
You can enter any type of expression in a cell (number, variable, function, string, etc.).
- Move the cursor to highlight the cell you want to enter or edit.
- Press ENTER or F3 to move the cursor to the entry line.
- Type a new value or edit the existing one.
- Press ENTER to enter the value into the highlighted cell.
When you press ENTER, the cursor automatically moves to highlight the next cell so that you can continue entering or editing values. However, the variable type affects the direction that the cursor moves.
Tip: To enter a new value, you can start typing without pressing ENTER or F3 first. However, you must use ENTER or F3 to edit an existing value.
Note: To enter a value from the entry line, you can also use ▸ or ▴.
| Variable Type | After ENTER, the cursor moves: |
|---|---|
| List or data | Down to the cell in the next row. |
| Matrix | Right to the cell in the next column. From the last cell in a row, the cursor automatically moves to the first cell in the next row. This lets you enter values for row1, row2, etc. |
Chapter 15: Data/Matrix Editor 243
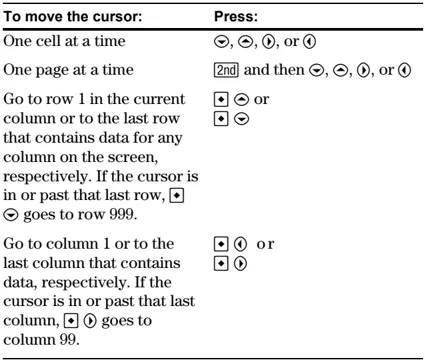
Scrolling through the Editor
| To move the cursor: | Press: |
|---|---|
| One cell at a time | ◀, ▶, ▲, or ▼ |
| One page at a time | [2nd] and then ◀, ▶, ▲, or ▼ |
| Go to row 1 in the current column or to the last row that contains data for any column on the screen, respectively. If the cursor is in or past that last row, ▼ goes to row 999. | [▲] ▲ or [▼] ▼ |
| Go to column 1 or to the last column that contains data, respectively. If the cursor is in or past that last column, [▶] ▶ goes to column 99. | [◀] ◀ or [▶] ▶ |
When you scroll down/up, the header row remains at the top of the screen so that the column numbers are always visible. When you scroll right/left, the row numbers remain on the left side of the screen so that they are always visible.
How Rows and Columns Are Filled Automatically
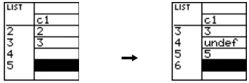
When you enter a value in a cell, the cursor moves to the next cell. However, you can move the cursor to any cell and enter a value. If you leave gaps between cells, the TI-89 / TI-92 Plus handles the gaps automatically.
- In a list variable, a cell in the gap is undefined until you enter a value for the cell.
Note: If you enter more than one column of elements in a list variable, it is converted automatically into a data variable.
- In a data variable, gaps in a column are handled the same as a list. However, if you leave a gap between columns, that column is blank.
244 Chapter 15: Data/Matrix Editor

• In a matrix variable, when you enter a value in a cell outside the current boundaries, additional rows and/or columns are added automatically to the matrix to include the new cell. Other cells in the new rows and/or columns are filled with zeros.
Note: Although you specify the size of a matrix when you create it, you can easily add additional rows and/or columns.
Changing the Cell Width
The cell width affects how many characters are displayed in any cell. To change the cell width in the Data/Matrix Editor:
Tip: Remember, to see a number in full precision, you can always highlight the cell and look at the entry line.
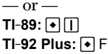
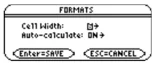
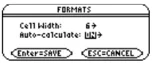
- To display the FORMATS dialog box, press F1 9 — or — TI-89: [♦] [1] TI-92 Plus: [♦] F
Cell width is the maximum number of characters that can be displayed in a cell.
All cells have the same cell width.
-
With the current Cell Width setting highlighted, press [◊] or [◊] to display a menu of digits (3 through 12).
-
Move the cursor to highlight a number and press [ENTER]. (For single-digit numbers, you can type the number and press [ENTER].)
-
Press [ENTER] to close the dialog box.
Clearing a Column or all Columns
This procedure erases the contents of a column. It does not delete the column.
Note: For a list or data variable, a clear column is empty. For a matrix, a clear column contains zeros.
To clear: Do this: A column 1. Move the cursor to any cell in the column. 2. TI-89: [2nd] [F6] TI-92 Plus: [F6] and select 5:Clear Column. (This item is not available for a matrix.) All columns Press [F1] and select 8:Clear Editor. When prompted for confirmation, press [ENTER] (or [ESC] to cancel).
Chapter 15: Data/Matrix Editor 245

Inserting and Deleting a Row, Column, or Cell
The general procedures for inserting and deleting a cell, row, or column are simple and straightforward. You can have up to 99 columns with up to 999 elements in each column.
Note About Column Titles and Headers You cannot delete the rows or cells that contain column titles or headers. Also, you cannot insert a row or cell before a column title or header.
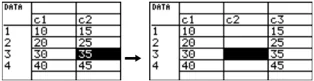
Inserting a Row or Column The new row or column is inserted before the row or column that contains the highlighted cell. In the Data/Matrix Editor:
- Move the cursor to any cell in the applicable row or column.
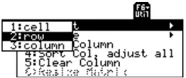
- TI-89: [2nd] [F6] TI-92 Plus: [F6] and select 1:Insert.
- Select either 2:row or 3:column.
Note: For a list variable, inserting a row is the same as inserting a cell.
When you insert a row:
- In a list or data variable, the row is undefined.
- In a matrix variable, the row is filled with zeros.
Note: For a list variable, you cannot insert a column because a list has only one column.
When you insert a column:
- In a data variable, the column is blank.
- In a matrix variable, the column is filled with zeros.
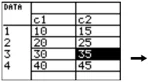
You can then enter values in the undefined or blank cells.
246 Chapter 15: Data/Matrix Editor
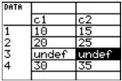
Inserting a Cell
The new cell is inserted before the highlighted cell in the same column. (You cannot insert a cell into a locked column, which is defined by a function in the column header. Refer to page 248.) In the Data/Matrix Editor:
- Move the cursor to the applicable cell.
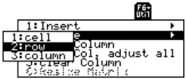
- TI-89: [2nd] [F6] TI-92 Plus: [F6] and select 1:Insert.
- Select 1:cell.
Note: For a matrix variable, you cannot insert a cell because the matrix must retain a rectangular shape.
The inserted cell is undefined. You can then enter a value in the cell.
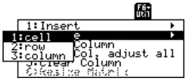
Deleting a Row or Column
In the Data/Matrix Editor:
- Move the cursor to any cell in the row or column you want to delete.
- TI-89: [2nd] [F6]
TI-92 Plus: [F6]
and select 2:Delete.
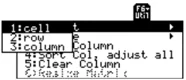
- Select either 2:row or 3:column.
If you delete a row, any rows below the deleted row are shifted up. If you delete a column, any columns to the right of the deleted column are shifted left.
Deleting a Cell
In the Data/Matrix Editor:
- Move the cursor to the cell you want to delete. (You cannot delete a cell in a locked column, which is defined by a function in the column header. Refer to page 248.)
Note: For a matrix variable, you cannot delete a cell because the matrix must retain a rectangular shape.
- TI-89: [2nd] [F6]
TI-92 Plus: [F6]
and select 2:Delete.
- Select 1:cell.
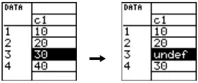
Any cells below the deleted cell are shifted up.
I f You Need to Add a New "Last" Row, Column, or Cell
You do not need to use the Util toolbar menu to:
• Add a new row or cell at the bottom of a column. — or — • Add a new column to the right of the last column.
Simply move the cursor to the applicable cell and enter a value.
Chapter 15: Data/Matrix Editor 247
Defining a Column Header with an Expression
For a list variable or a column in a data variable, you can enter a function in the column header that automatically generates a list of elements. In a data variable, you can also define one column in terms of another.
Entering a Header Definition
In the Data/Matrix Editor:
- Move the cursor to any cell in the column and press F4. — or — Move the cursor to the header cell (c1, c2, etc.) and press ENTER.
Note: ENTER is not required if you want to type a new definition or replace the existing one. However, if you want to edit the existing definition, you must press ENTER.
Tip: To view an existing definition, press F4 or move the cursor to the header cell and look at the entry line.
- Type the new expression, which replaces any existing definition.
If you used F4 or ENTER in Step 1, the cursor moved to the entry line and highlighted the existing definition, if any. You can also:
*Press CLEAR to clear the highlighted expression. Then type the new expression. — or — *Press ◄ or ► to remove the highlighting. Then edit the old expression.
Tip: To cancel any changes, press ESC before pressing ENTER.
You can use an expression that: For example: Generates a series of numbers. c1=seq(x^2,x,1,5) c1={1,2,3,4,5} Refers to another column. c2=2c1 c4=c1c2-sin(c3)
Note: The seq function is described in Appendix A.
Note: If you refer to an empty column, you will get an error message (unless Auto-calculate = OFF as described on page 249).
- Press ENTER, , or ⨁ to save the definition and update the columns.
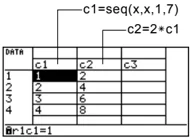
Note: For a data variable, header definitions are saved when you leave the Data/Matrix Editor. For a list variable, the definitions are not saved (only their resulting cell values).
You cannot directly change a locked cell (■) since it is defined by the column header.
Clearing a Header Definition
-
Move the cursor to any cell in the column and press F4. —or— Move the cursor to the header cell (c1, c2, etc.) and press ENTER.
-
Press CLEAR to clear the highlighted expression.
-
Press ENTER, ⨀, or ⨁.
248 Chapter 15: Data/Matrix Editor
Using an Existing List as a Column
Suppose you have one or more existing lists, and you want to use those existing lists as columns in a data variable.
Note: If you have a CBL 2™/CBL™ or CBR™, use these techniques for your collected lists.
\begin{tabular}{ll} \hline From the: & Do this: \ \hline Data/Matrix Editor & In the applicable column, use F4 to define the column header. Refer to the existing list variable. For example: c1=list1 \ Home screen or a program & Use the NewData command as described in Appendix A. For example: NewData datavar, list1 [, list2] [, list3] ... \newline Existing list variables to copy to columns in the data variable. \newline Data variable. If this data variable already exists, it will be redefined based on the specified lists. \ \hline \end{tabular}
Tip: Use 2nd [VAR-LINK] to see existing list variables.
To Fill a Matrix with a List
You cannot use the Data/Matrix Editor to fill a matrix with a list. However, you can use the list\blacktrianglerightmat command from the Home screen or a program. For information, refer to Appendix A.
The Auto-calculate Feature
For list and data variables, the Data/Matrix Editor has an Auto-calculate feature. By default, Auto-calculate = ON. Therefore, if you make a change that affects a header definition (or any column referenced in a header definition), all header definitions are recalculated automatically. For example:
- If you change a header definition, the new definition is applied automatically.
- If column 2's header is defined as c2=2*c1, any change you make in column 1 is automatically reflected in column 2.
Tip: You may want to set Auto-calculate = OFF to:
To turn Auto-calculate off and on from the Data/Matrix Editor:
- Press F1 9 —or— TI-89: [◆] [1] TI-92 Plus: [◆] F
- Change Auto-Calculate to OFF or ON.
- Press [ENTER] to close the dialog box.
If Auto-calculate = OFF and you make changes as described above, the header definitions are not recalculated until you set Auto-calculate = ON.
Chapter 15: Data/Matrix Editor 249
Using Shift and CumSum Functions in a Column Header
When defining a column header, you can use the shift and cumSum functions as described below. These descriptions differ slightly from Appendix A. This section describes how to use the functions in the Data/Matrix Editor. Appendix A gives a more general description for the Home screen or a program.
Using the Shift Function
The shift function copies a base column and shifts it up or down by a specified number of elements. Use F4 to define a column header with the syntax:
shift (column [,integer])
Number of elements to shift (positive shifts up; negative shifts down). Default is -1. Column used as the base for the shift.
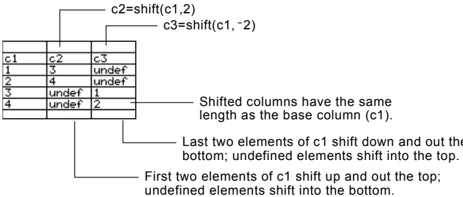
For example, for a two-element shift up and down:
c2=shift(c1,2) c3=shift(c1,-2)
Note: To enter "shift", type it from the keyboard or select it from the CATALOG.
\begin{tabular}{|l|l|l|} \hline c1 & c2 & c3 \ \hline 1 & 3 & undef \ 2 & 4 & undef \ 3 & undef & 1 \ 4 & undef & 2 \ \hline \end{tabular}
Shifted columns have the same length as the base column (c1). Last two elements of c1 shift down and out the bottom; undefined elements shift into the top. First two elements of c1 shift up and out the top; undefined elements shift into the bottom.
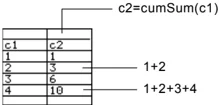
Using the CumSum Function
The cumSum function returns a cumulative sum of the elements in a base column. Use F4 to define a column header with the syntax:
cumSum (column)
Column used as the base for the cumulative sum
For example:
c2=cumSum(c1)
Note: To enter "cumSum", type it, select it from the CATALOG, or press 2nd [MATH] and select it from the List submenu.
250 Chapter 15: Data/Matrix Editor

Sorting Columns
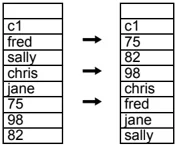
After entering information in a data, list, or matrix variable, you can easily sort a specified column in numeric or alphabetical order. You can also sort all columns as a whole, based on a "key" column.
Sorting a Single Column
In the Data/Matrix Editor:
- Move the cursor to any cell in the column.
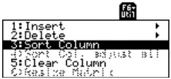
- TI-89: 2nd [F6] TI-92 Plus: [F6] and select 3:Sort Column.
Numbers are sorted in ascending order.
Character strings are sorted in alphabetical order.
Sorting All Columns Based on a “Key” Column
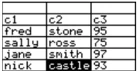
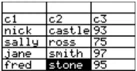
Consider a database structure in which each column along the same row contains related information (such as a student’s first name, last name, and test scores). In such a case, sorting only a single column would destroy the relationship between the columns.
Note: For a list variable, this is the same as sorting a single column.
In the Data/Matrix Editor:
- Move the cursor to any cell in the “key” column.
In this example, move the cursor to the second column (c2) to sort by last name.
Note: This menu item is not available if any column is locked.
- TI-89: 2nd [F6] TI-92 Plus: [F6] and select 4:Sort Col, adjust all.
When using this procedure for a data variable:
- All columns must have the same length.
- None of the columns can be locked (defined by a function in the column header). When the cursor is in a locked column, 📷 is shown at the beginning of the entry line.
Chapter 15: Data/Matrix Editor 251
Saving a Copy of a List, Data, or Matrix Variable
You can save a copy of a list, data, or matrix variable. You can also copy a list to a data variable, or you can select a column from a data variable and copy that column to a list.
Valid Copy Types
Note: A list is automatically converted to a data variable if you enter more than one column of information.
| You can copy a: | To a: |
|---|---|
| List | List or data |
| Data | Data |
| Data column | List |
| Matrix | Matrix |
Procedure
From the Data/Matrix Editor:
- Display the variable that you want to copy.
- Press [F1] and select 2:Save Copy As.
- In the dialog box:
- Select the Type and Folder for the copy.
- Type a variable name for the copy.
- When available, select the column to copy from.
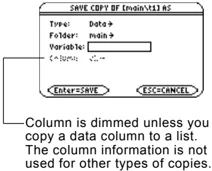
Note: If you type the name of an existing variable, its contents will be replaced.
Column is dimmed unless you copy a data column to a list. The column information is not used for other types of copies.
- Press [ENTER] (after typing in an input box such as Variable, you must press [ENTER] twice).
To Copy a Data Column to a List
A data variable can have multiple columns, but a list variable can have only one column. Therefore, when copying from a data variable to a list, you must select the column that you want to copy.
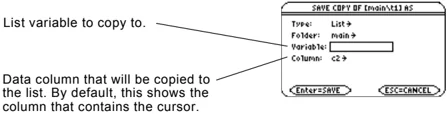
List variable to copy to.
Data column that will be copied to the list. By default, this shows the column that contains the cursor.
252 Chapter 15: Data/Matrix Editor
Statistics and Data Plots
16
- Preview of Statistics and Data Plots ........ 254
- Overview of Steps in Statistical Analysis ........ 258
- Performing a Statistical Calculation ........ 259
- Statistical Calculation Types ........ 261
- Statistical Variables ........ 263
- Defining a Statistical Plot ........ 264
- Statistical Plot Types ........ 266
- Using the Y= Editor with Stat Plots ........ 268
- Graphing and Tracing a Defined Stat Plot ........ 269
- Using Frequencies and Categories ........ 270
- If You Have a CBL 2/CBL or CBR ........ 272
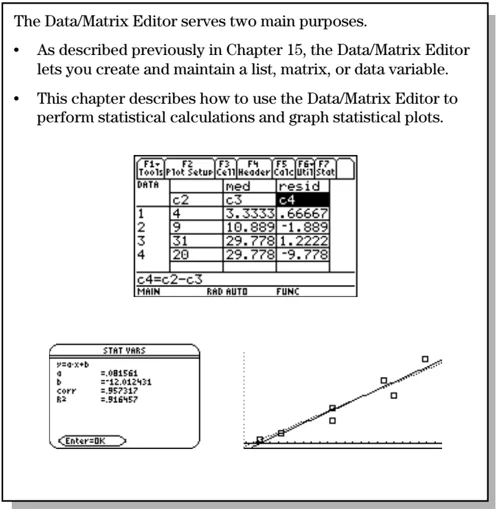
The Data/Matrix Editor serves two main purposes.
- As described previously in Chapter 15, the Data/Matrix Editor lets you create and maintain a list, matrix, or data variable.
- This chapter describes how to use the Data/Matrix Editor to perform statistical calculations and graph statistical plots.

Chapter 16: Statistics and Data Plots 253
Preview of Statistics and Data Plots
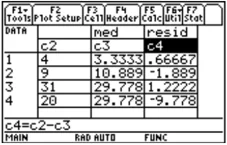
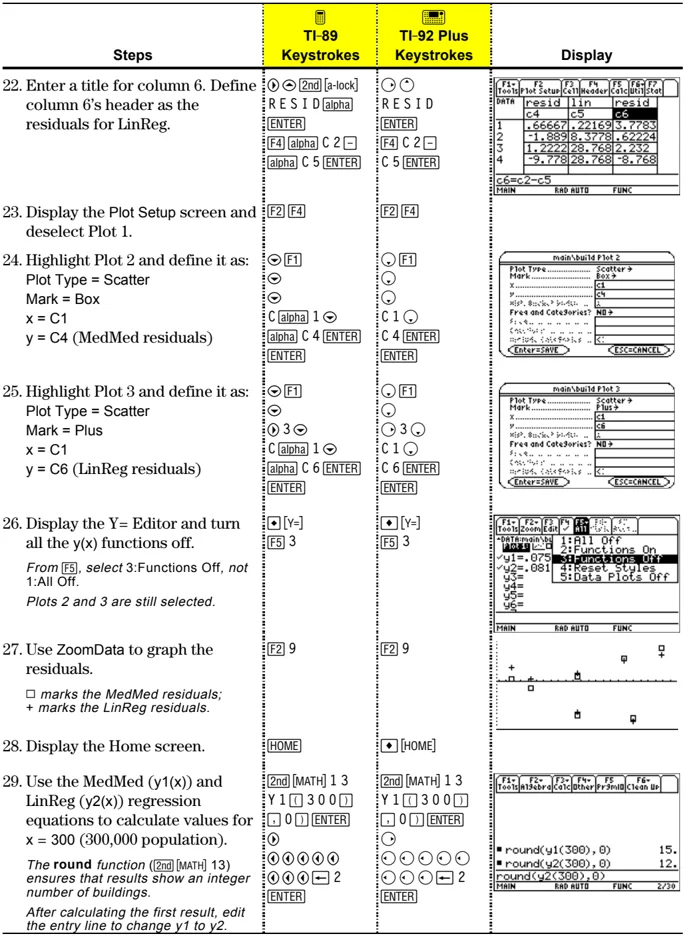
Based on a sample of seven cities, enter data that relates population to the number of buildings with more than 12 stories. Using Median-Median and linear regression calculations, find and plot equations to fit the data. For each regression equation, predict how many buildings of more than 12 stories you would expect in a city of 300,000 people.
| Steps | TI-89 Keystrokes | TI-92 Plus Keystrokes | Display |
|---|---|---|---|
| 1. Display the MODE dialog box. For Graph mode, select FUNCTION. | MODE▶ 1ENTER |
MODE▶ 1ENTER |
|
| 2. Display the Data/Matrix Editor, and create a new data variable named BUILD. | APPS 6 3▽ ▽B U I L DENTER ENTER |
APPS 6 3▽ ▽B U I L DENTER ENTER |
|
| 3. Using the sample data below, enter the population in column 1.Pop. (in 1000s) Bldgs > 12 stories150 4500 31800 42250 9500 20750 55950 73 | 1 5 0 ENTER5 0 0 ENTER8 0 0 ENTER2 5 0 ENTER5 0 0 ENTER7 5 0 ENTER9 5 0 ENTER |
1 5 0 ENTER5 0 0 ENTER8 0 0 ENTER2 5 0 ENTER5 0 0 ENTER7 5 0 ENTER9 5 0 ENTER |
|
4. Move the cursor to row 1 in column 2 (r1c2). Then enter the corresponding number of buildings.▽ ◀ ▶ moves the cursor to the top of the page. After typing data for a cell, you can press ENTER or ▶ to enter the data and move the cursor down one cell. Pressing ▶ enters the data and moves the cursor up one cell. |
▶ ◀ ▶4 ENTER3 1 ENTER4 2 ENTER9 ENTER2 0 ENTER5 5 ENTER7 3 ENTER |
▶ 2nd ▶4 ENTER3 1 ENTER4 2 ENTER9 ENTER2 0 ENTER5 5 ENTER7 3 ENTER |
|
5. Move the cursor to row 1 in column 1 (r1c1). Sort the data in ascending order of population.This sorts column 1 and then adjusts all other columns so that they retain the same order as column 1. This is critical for maintaining the relationships between columns of data.To sort column 1, the cursor can be anywhere in column 1. This example has you press TI-89: ▼ ◀TI-92 Plus: 2nd ▶ so that you can see the first four rows. |
▶ ◀ ▶2nd [F6] 4 |
▶ 2nd ▶F6 4 |
254 Chapter 16: Statistics and Data Plots
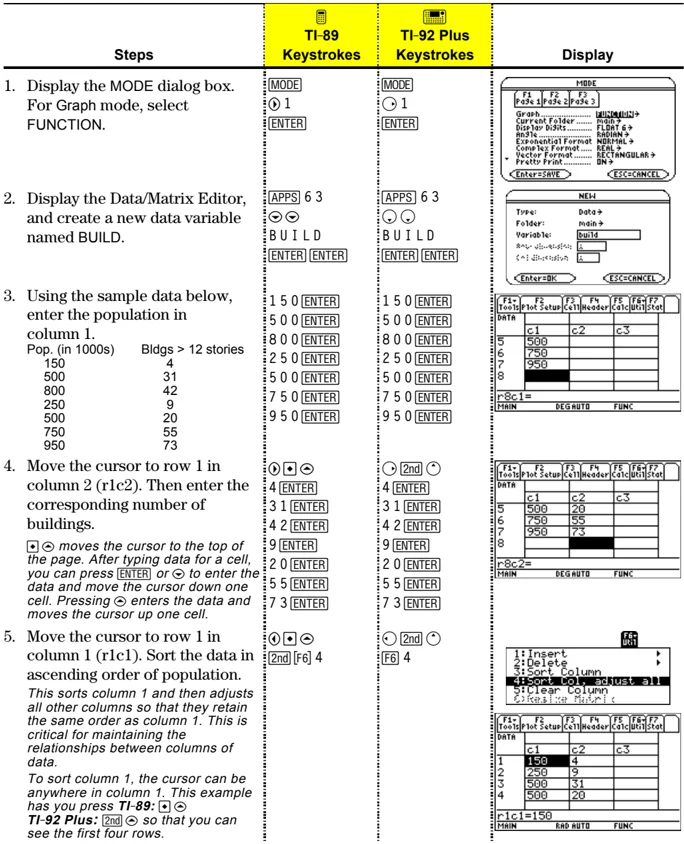
| Steps | TI-89 Keystrokes | TI-92 Plus Keystrokes | Display |
|---|---|---|---|
| 6. Display the Calculate dialog box.Set:Calculation Type = MedMedx = C1y = C2Store RegEQ to = y1(x) | F57 \circC alpha 1 \circalpha C 2 \circ\circ \circ ENTER | F57 \circC 1 \circC 2 \circ\circ \circ ENTER | |
| 7. Perform the calculation to display the MedMed regression equation.As specified on the Calculate dialog box, this equation is stored in y1(x). | ENTER | ENTER | |
| 8. Close the STAT VARS screen.The Data/Matrix Editor displays. | ENTER | ENTER | |
| 9. Display the Calculate dialog box.Set:Calculation Type = LinRegx = C1y = C2Store RegEQ to = y2(x) | F55 \circ\circ\circ\circ \circ ENTER | F55 \circ\circ\circ\circ \circ ENTER | |
| 10. Perform the calculation to display the LinReg regression equation.This equation is stored in y2(x). | ENTER | ENTER | |
| 11. Close the STAT VARS screen.The Data/Matrix Editor displays. | ENTER | ENTER | |
| 12. Display the Plot Setup screen.Plot 1 is highlighted by default.F3 lets you clear highlighted Plot settings. | F2 | F2 | |
| 13. Define Plot 1 as:Plot Type = ScatterMark = Boxx = C1y = C2Notice the similarities between this and the Calculate dialog box. | F11 \circ1 \circC alpha 1 \circalpha C 2 | F11 \circ1 \circC 1 \circC 2 | |
| 14. Save the plot definition and return to the Plot Setup screen.Notice the shorthand notation for Plot 1's definition. | ENTER ENTER | ENTER ENTER |
Chapter 16: Statistics and Data Plots 255
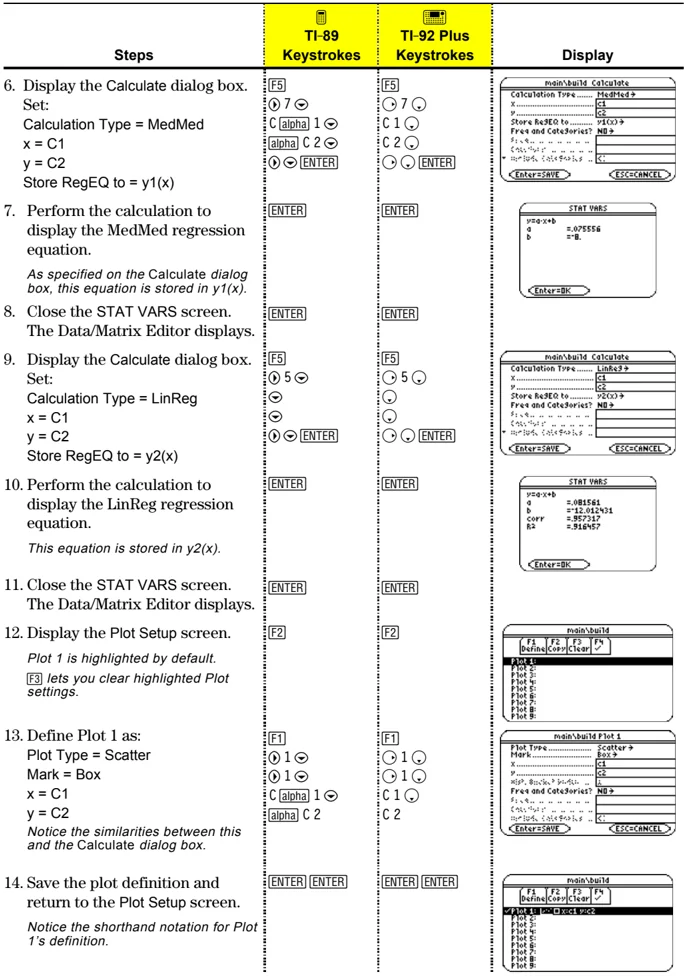
| Steps | TI-89 Keystrokes | TI-92 Plus Keystrokes | Display |
|---|
- Display the Y= Editor. For y1(x), the MedMed regression equation, set the display style to Dot.
Note: Depending on the previous contents of your Y= Editor, you may need to move the cursor to y1. PLOTS 1 at the top of the screen means that Plot 1 is selected. Notice that y1(x) and y2(x) were selected when the regression equations were stored. | \blacklozenge [Y=] [2nd] [F6] 2 | \blacklozenge [Y=] [F6] 2 | 16. Scroll up to highlight Plot 1.
The displayed shorthand definition is the same as on the Plot Setup screen. | \circlearrowleft | \circlearrowleft | 17. Use ZoomData to graph Plot 1 and the regression equations y1(x) and y2(x).
ZoomData examines the data for all selected stat plots and adjusts the viewing window to include all points. | [F2] 9 | [F2] 9 | 18. Return to the current session of the Data/Matrix Editor. | [APPS] 6 1 | [APPS] 6 1 | 19. Enter a title for column 3. Define column 3's header as the values predicted by the MedMed line.
To enter a title, the cursor must highlight the title cell at the very top of the column. [F4] lets you define a header from anywhere in a column. When the cursor is on a header cell, pressing [F4] is not required. | \circlearrowright \circlearrowleft \circlearrowright \circlearrowleft [2nd] [a-lock] M E D [alpha] [ENTER] [F4] Y 1 ( [alpha] C 1 [ ] [ENTER] | \circlearrowright \circlearrowright \circlearrowright \circlearrowright M E D [ENTER] [F4] Y 1 ( C 1 [ ] [ENTER] | 20. Enter a title for column 4. Define column 4's header as the residuals (difference between observed and predicted values) for MedMed. | \circlearrowright \circlearrowleft [2nd] [a-lock] R E S I D [alpha] [ENTER] [alpha] C 2 [-] [alpha] C 3 [ENTER] | \circlearrowright \circlearrowright R E S I D [ENTER] [F4] C 2 [-] C 3 [ENTER] | 21. Enter a title for column 5. Define column 5's header as the values predicted by the LinReg line. | \circlearrowright \circlearrowleft \circlearrowright [2nd] [a-lock] L I N [alpha] [ENTER] [F4] Y 2 ( [alpha] C 1 [ ] [ENTER] | \circlearrowright \circlearrowright L I N [ENTER] [F4] Y 2 ( C 1 [ ] [ENTER] |
256 Chapter 16: Statistics and Data Plots
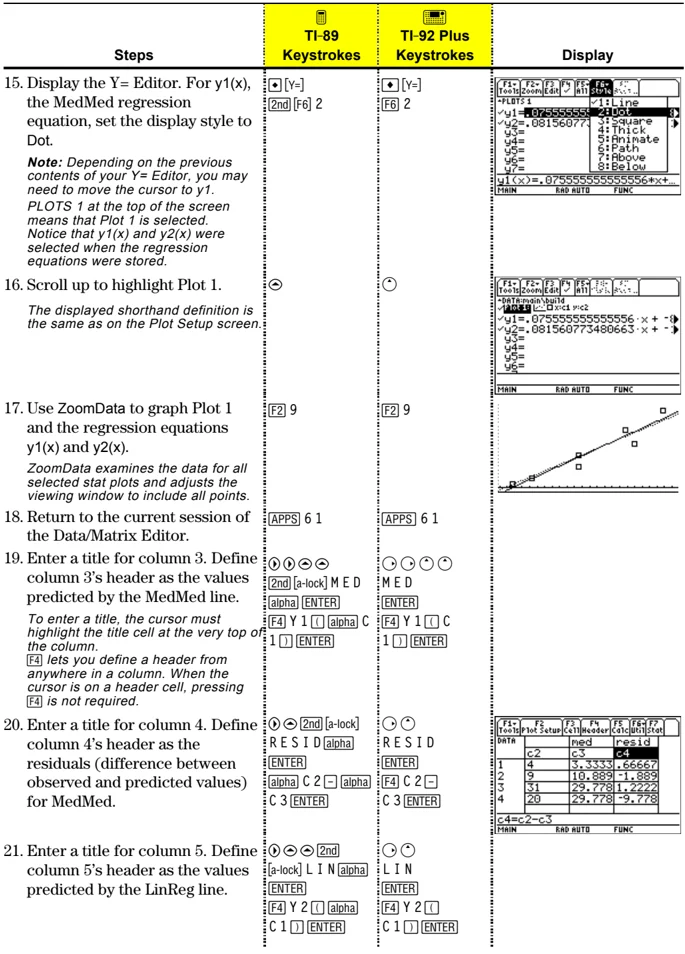
-
Enter a title for column 6. Define column 6's header as the residuals for LinReg. TI-89 Keystrokes: \diamond \oslash [2nd] [a-lock] RESID [alpha] ENTER [F4] [alpha] C 2 \square [alpha] C 5 ENTER TI-92 Plus Keystrokes: \diamond \circ RESID ENTER [F4] C 2 \square C 5 ENTER Display:
-
Display the Plot Setup screen and deselect Plot 1. TI-89 Keystrokes: [F2] [F4] TI-92 Plus Keystrokes: [F2] [F4]
-
Highlight Plot 2 and define it as: Plot Type = Scatter Mark = Box x = C1 y = C4 (MedMed residuals) TI-89 Keystrokes: \diamond [F1] \diamond \diamond C [alpha] 1 \diamond [alpha] C 4 ENTER ENTER TI-92 Plus Keystrokes: \diamond [F1] \diamond \diamond C 1 \diamond C 4 ENTER ENTER Display:
-
Highlight Plot 3 and define it as: Plot Type = Scatter Mark = Plus x = C1 y = C6 (LinReg residuals) TI-89 Keystrokes: \diamond [F1] \diamond \diamond 3 \diamond C [alpha] 1 \diamond [alpha] C 6 ENTER ENTER TI-92 Plus Keystrokes: \diamond [F1] \diamond \diamond 3 \diamond C 1 \diamond C 6 ENTER ENTER Display:
-
Display the Y= Editor and turn all the y(x) functions off. From [F5], select 3:Functions Off, not 1:All Off. Plots 2 and 3 are still selected. TI-89 Keystrokes: \blacklozenge [Y=] [F5] 3 TI-92 Plus Keystrokes: \blacklozenge [Y=] [F5] 3 Display:
-
Use ZoomData to graph the residuals. \square marks the MedMed residuals; $+$ marks the LinReg residuals. TI-89 Keystrokes: [F2] 9 TI-92 Plus Keystrokes: [F2] 9 Display:
-
Display the Home screen. TI-89 Keystrokes: [HOME] TI-92 Plus Keystrokes: \blacklozenge [HOME]
-
Use the MedMed (y1(x)) and LinReg (y2(x)) regression equations to calculate values for x = 300 (300,000 population). The round function ([2nd] [MATH] 13) ensures that results show an integer number of buildings. After calculating the first result, edit the entry line to change y1 to y2. TI-89 Keystrokes: [2nd] [MATH] 1 3 Y 1 \square 3 0 0 \square \square 0 \square ENTER \diamond \diamond \diamond \diamond \diamond \diamond \diamond \diamond \diamond \diamond \leftarrow 2 ENTER TI-92 Plus Keystrokes: [2nd] [MATH] 1 3 Y 1 \square 3 0 0 \square \square 0 \square ENTER \diamond \diamond \diamond \diamond \diamond \diamond \diamond \diamond \diamond \diamond \leftarrow 2 ENTER Display:
Chapter 16: Statistics and Data Plots 257
Overview of Steps in Statistical Analysis
This section gives an overview of the steps used to perform a statistical calculation or graph a statistical plot. For detailed descriptions, refer to the following pages.
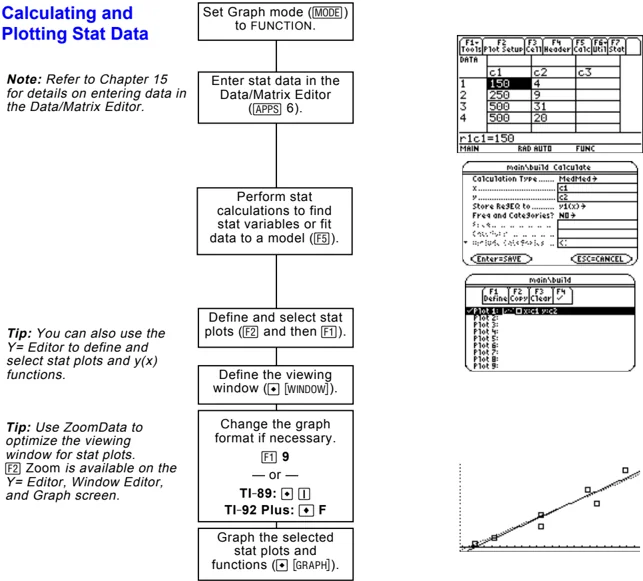
Calculating and Plotting Stat Data
Note: Refer to Chapter 15 for details on entering data in the Data/Matrix Editor.
Set Graph mode ([MODE]) to FUNCTION.
Enter stat data in the Data/Matrix Editor ([APPS] 6).
Perform stat calculations to find stat variables or fit data to a model ([F5]).
Tip: You can also use the Y= Editor to define and select stat plots and y(x) functions.
Define and select stat plots ([F2] and then [F1]).
Define the viewing window ([♦] [WINDOW]).
Tip: Use ZoomData to optimize the viewing window for stat plots. [F2] Zoom is available on the Y= Editor, Window Editor, and Graph screen.
Change the graph format if necessary. [F1] 9 — or — TI-89: [♦] [1] TI-92 Plus: [♦] F
Graph the selected stat plots and functions ([♦] [GRAPH]).
Exploring the Graphed Plots
From the Graph screen, you can:
- Display the coordinates of any pixel by using the free-moving cursor, or of a plotted point by tracing a plot.
- Use the [F2] Zoom toolbar menu to zoom in or out on a portion of the graph.
- Use the [F5] Math toolbar menu to analyze any function (but not plots) that may be graphed.
258 Chapter 16: Statistics and Data Plots