8 Specifications
8.1 Absolute Maximum Ratings
over operating temperature ranges (unless otherwise noted)(1)
| Parameter | MIN | MAX | UNIT | |
|---|---|---|---|---|
| Supply voltage | VDDIO | –0.3 | 4.6 | V |
| VDD3VFL | –0.3 | 4.6 | ||
| VDDA1 | –0.3 | 4.6 | ||
| VDDA2 | –0.3 | 4.6 | ||
| VDDAIO | –0.3 | 4.6 | ||
| AVDDREFBG | –0.3 | 4.6 | ||
| Supply voltage | VDD | –0.5 | 2.5 | V |
| VDD1 | –0.5 | 2.5 | ||
| Input voltage | VIN | –0.3 | 4.6 | V |
| Output voltage | VO | –0.3 | 4.6 | V |
| Input clamp current | IIK (VIN < 0 or VIN > VDDIO)(2) | –20 | 20 | mA |
| Output clamp current | IOK (VO < 0 or VO > VDDIO) | –20 | 20 | mA |
| Operating ambient temperature, TA | A version (GHH, ZHH, PGF, PBK)(3) | –40 | 85 | °C |
| S version (GHH, ZHH, PGF, PBK)(3) | –40 | 125 | ||
| Q version (PGF, PBK)(3) | –40 | 125 | ||
| Junction temperature | TJ | –40 | 150 | °C |
| Storage temperature | Tstg (3) | –65 | 150 | °C |
(1) Stresses beyond those listed under Absolute Maximum Ratings may cause permanent damage to the device. These are stress ratings only, and functional operation of the device at these or any other conditions beyond those indicated under Section 8.4 is not implied. Exposure to absolute-maximum-rated conditions for extended periods may affect device reliability. All voltage values are with respect to VSS.
(2) Continuous clamp current per pin is ±2 mA
(3) Long-term high-temperature storage and/or extended use at maximum temperature conditions may result in a reduction of overall device life. For additional information, see the Semiconductor and IC Package Thermal Metrics Application Report.

8.2 ESD Ratings – Commercial
| VALUE | UNIT | ||
|---|---|---|---|
| TMS320F2812 in 179-ball ZHH package | |||
| V(ESD) Electrostatic discharge (ESD) | Human-body model (HBM), per ANSI/ESDA/JEDEC JS-001(1) | ±2000 | V |
| Charged-device model (CDM), per JEDEC specification JESD22-C101(2) | ±500 | ||
| TMS320F2812 in 179-ball GHH package | |||
| V(ESD) Electrostatic discharge (ESD) | Human-body model (HBM), per ANSI/ESDA/JEDEC JS-001(1) | ±2000 | V |
| Charged-device model (CDM), per JEDEC specification JESD22-C101(2) | ±500 |
(1) JEDEC document JEP155 states that 500-V HBM allows safe manufacturing with a standard ESD control process. (2) JEDEC document JEP157 states that 250-V CDM allows safe manufacturing with a standard ESD control process.
8.3 ESD Ratings – Automotive
| VALUE | UNIT | |||
|---|---|---|---|---|
| TMS320F2812 in 176-pin PGF package | ||||
| V(ESD) Electrostatic discharge | Human body model (HBM), per AEC Q100-002(1) | All pins | ±2000 | V |
| Charged device model (CDM), per AEC Q100-011 | All pins | ±500 | ||
| Corner pins on 176-pin PGF: 1, 44, 45, 88, 89, 132, 133, 176 | ±750 | |||
| TMS320F2810 and TMS320F2811 in 128-pin PBK package | ||||
| V(ESD) Electrostatic discharge | Human body model (HBM), per AEC Q100-002(1) | All pins | ±2000 | V |
| Charged device model (CDM), per AEC Q100-011 | All pins | ±500 | ||
| Corner pins on 128-pin PBK: 1, 32, 33, 64, 65, 96, 97, 128 | ±750 |
(1) AEC Q100-002 indicates HBM stressing is done in accordance with the ANSI/ESDA/JEDEC JS-001 specification.
8.4 Recommended Operating Conditions
| MIN(1) | NOM | MAX | UNIT | ||
|---|---|---|---|---|---|
| Device supply voltage, I/O, VDDIO | 3.14 | 3.3 | 3.47 | V | |
| Device supply voltage, CPU, VDD, VDD1 | 1.8 V (135 MHz) | 1.71 | 1.8 | 1.89 | V |
| 1.9 V (150 MHz) | 1.81 | 1.9 | 2 | ||
| Supply ground, VSS | 0 | V | |||
| ADC supply voltage, VDDA1, VDDA2, AVDDREFBG, VDDAIO | 3.14 | 3.3 | 3.47 | V | |
| Flash programming supply voltage, VDD3VFL | 3.14 | 3.3 | 3.47 | V | |
| Device clock frequency (system clock), fSYSCCLKOUT | VDD = 1.9 V ± 5% | 2 | 150 | MHz | |
| VDD = 1.8 V ± 5% | 2 | 135 | |||
| High-level input voltage, VIH | All inputs except X1/XCLKIN | 2 | VDDIO | V | |
| X1/XCLKIN (@ 50 μA max) | 0.7VDD | VDD | |||
| Low-level input voltage, VIL | All inputs except X1/XCLKIN | 0.8 | V | ||
| X1/XCLKIN (@ 50 μA max) | 0.3VDD | ||||
| High-level output source current, VOH = 2.4 V, IOH | All I/Os except Group 2 | –4 | mA | ||
| Group 2(2) | –8 | ||||
| Low-level output sink current, VOL = VOL MAX, IOL | All I/Os except Group 2 | 4 | mA | ||
| Group 2(2) | 8 | ||||
| Ambient temperature, TA | A version | –40 | 85 | °C | |
| S version | –40 | 125 | |||
| Q version | –40 | 125 |
(1) See Section 8.12.2 for power sequencing of VDDIO, VDDAIO, VDD, VDDA1/VDDA2/AVDDREFBG, and VDD3VFL.
(2) Group 2 pins are as follows: XINTF pins, T1CTRIP_PDPINTA, TDO, XCLKOUT, XF, EMU0, and EMU1.

8.5 Power Consumption Summary
8.5.1 TMS320F281x Current Consumption by Power-Supply Pins Over Recommended Operating Conditions During Low-Power Modes at 150-MHz SYSCLKOUT
| MODE | TEST CONDITIONS | IDD | IDDIO (1) | IDD3VFL | IDDA (2) | ||||
|---|---|---|---|---|---|---|---|---|---|
| TYP | MAX(3) | TYP | MAX(3) | TYP | MAX(3) | TYP | MAX(3) | ||
| Operational | All peripheral clocks are enabled. All PWM pins are toggled at 100 kHz. Data is continuously transmitted out of the SCIA, SCIB, and CAN ports. The hardware multiplier is exercised. Code is running out of flash with 5 wait-states. | 195 mA(4) | 230 mA | 15 mA | 30 mA | 40 mA | 45 mA | 40 mA | 50 mA |
| IDLE | • Flash is powered down• XCLKOUT is turned off• All peripheral clocks are on, except ADC | 125 mA | 150 mA | 5 mA | 10 mA | 2 µA | 4 µA | 1 µA | 20 µA |
| STANDBY | • Flash is powered down• Peripheral clocks are turned off• Pins without an internal PU/PD are tied high/low | 5 mA | 10 mA | 5 µA | 20 µA | 2 µA | 4 µA | 1 µA | 20 µA |
| HALT | • Flash is powered down• Peripheral clocks are turned off• Pins without an internal PU/PD are tied high/low• Input clock is disabled | 70 µA | 5 µA | 20 µA | 2 µA | 4 µA | 1 µA | 20 µA |
(1) IDDIO current is dependent on the electrical loading on the I/O pins.
(2) IDDA includes current into VDDA1, VDDA2, AVDDREFBG, and VDDAIO pins.
(3) MAX numbers are at 125°C, and MAX voltage (VDD = 1.89 V; VDDIO, VDD3VFL, VDDA = 3.47 V).
(4) IDD represents the total current drawn from the 1.8-V rail (VDD). It includes a small amount of current (<1 mA) drawn by VDD1.
Note
HALT and STANDBY modes cannot be used when the PLL is disabled.
TMS320F2810, TMS320F2810-Q1, TMS320F2811, TMS320F2811-Q1 TMS320F2812, TMS320F2812-Q1
www.ti.com SPRS174V – APRIL 2001 – REVISED FEBRUARY 2021
8.5.2 Current Consumption Graphs
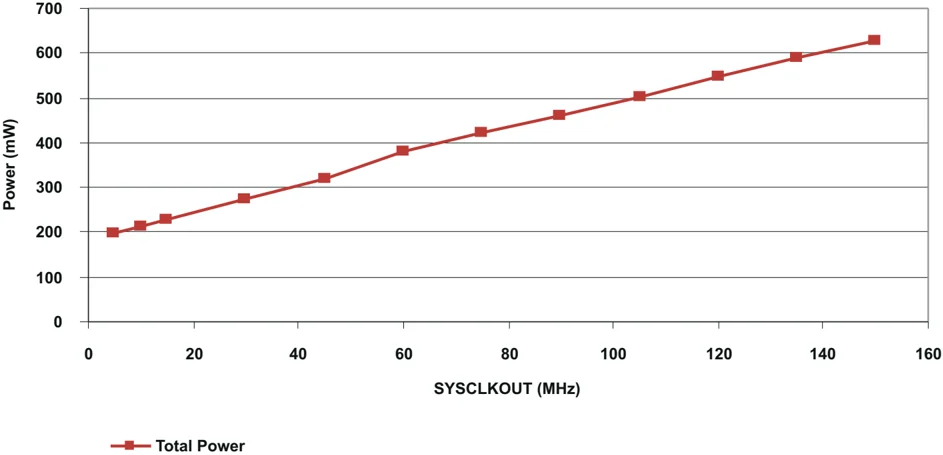
A. Test conditions are as defined in Section 8.5.1 for operational currents. B. $I_{DD}$ represents the total current drawn from the 1.8-V rail ($V_{DD}$). It includes a small amount of current (<1 mA) drawn by $V_{DD1}$. C. $I_{DDA}$ represents the current drawn by $V_{DDA1}$ and $V_{DDA2}$ rails. D. Total 3.3-V current is the sum of $I_{DDIO}$, $I_{DD3VFL}$, and $I_{DDA}$. It includes a small amount of current (<1 mA) drawn by $V_{DDAIO}$.
Figure 8-1. Typical Current Consumption Over Frequency
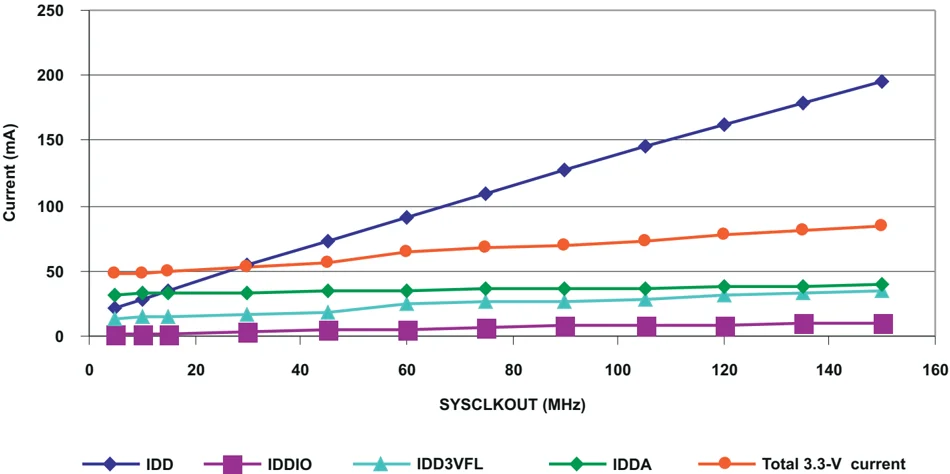
Figure 8-2. Typical Power Consumption Over Frequency
8.5.3 Reducing Current Consumption
28x DSPs incorporate a unique method to reduce the device current consumption. A reduction in current consumption can be achieved by turning off the clock to any peripheral module which is not used in a given application. Table 8-1 indicates the typical reduction in current consumption achieved by turning off the clocks to various peripherals.
Table 8-1. Typical Current Consumption by Various Peripherals (at 150 MHz)
| PERIPHERAL MODULE(1) (3) | IDD CURRENT REDUCTION (mA) |
|---|---|
| eCAN | 12 |
| EVA | 6 |
| EVB | 6 |
| ADC | 8(2) |
| SCI | 4 |
| SPI | 5 |
| McBSP | 13 |
(1) All peripheral clocks are disabled upon reset. Writing to/reading from peripheral registers is possible only after the peripheral clocks are turned on.
(2) This number represents the current drawn by the digital portion of the ADC module. Turning off the clock to the ADC module results in the elimination of the current drawn by the analog portion of the ADC (IDDA) as well.
(3) Power savings can be achieved by powering down the flash. This must be done by code running off RAM (not flash).
8.6 Electrical Characteristics
over recommended operating conditions (unless otherwise noted)
| PARAMETER | TEST CONDITIONS | MIN | TYP | MAX | UNIT | ||
|---|---|---|---|---|---|---|---|
| VOH High-level output voltage | IOH = IOH MAX | 2.4 | V | ||||
| IOH = 50 μA | VDDIO – 0.2 | ||||||
| VOL Low-level output voltage | IOL = IOL MAX | 0.4 | V | ||||
| IIL Input current (low level) | With pullup | VDDIO = 3.3 V, VIN = 0 V | All I/Os(1) (including XRS) except EVB | –80 | –140 | –190 | μA |
| GPIOB/EVB | –13 | –25 | –35 | ||||
| With pulldown | VDDIO = 3.3 V, VIN = 0 V | ±2 | |||||
| IIH Input current (high level) | With pullup | VDDIO = 3.3 V, VIN = VDD | ±2 | μA | |||
| With pulldown(2) | VDDIO = 3.3 V, VIN = VDD | 28 | 50 | 80 | |||
| IOZ Leakage current (for pins without internal PU/PD), high-impedance state (off-state) | VO = VDDIO or 0 V | ±2 | μA | ||||
| Ci Input capacitance | 2 | pF | |||||
| Co Output capacitance | 3 | pF |
(1) The following pins have no internal PU/PD: GPIOE0, GPIOE1, GPIOF0, GPIOF1, GPIOF2, GPIOF3, GPIOF12, GPIOG4, and GPIOG5.
(2) The following pins have an internal pulldown: XMP/ \overlineMC, TESTSEL, and TRST.
8.7 Thermal Resistance Characteristics for 179-Ball GHH Package
| °C/W(1) | ||
|---|---|---|
| RΘJC | Junction-to-case thermal resistance | 16.08 |
| RΘJA | Junction-to-free air thermal resistance | 42.57 |
| PsiJT | Junction-to-package top | 0.658 |
(1) These values are based on a JEDEC defined 2S2P system (with the exception of the Theta JC [RΘJC] value, which is based on a JEDEC defined 1S0P system) and will change based on environment as well as application. For more information, see these EIA/JEDEC standards:
- JESD51-2, Integrated Circuits Thermal Test Method Environmental Conditions - Natural Convection (Still Air)
- JESD51-3, Low Effective Thermal Conductivity Test Board for Leaded Surface Mount Packages
- JESD51-7, High Effective Thermal Conductivity Test Board for Leaded Surface Mount Packages
- JESD51-9, Test Boards for Area Array Surface Mount Package Thermal Measurements
8.8 Thermal Resistance Characteristics for 179-Ball ZHH Package
| °C/W(1) | ||
|---|---|---|
| RΘJC | Junction-to-case thermal resistance | 16.08 |
| RΘJA | Junction-to-free air thermal resistance | 42.57 |
| PsiJT | Junction-to-package top | 0.658 |
(1) These values are based on a JEDEC defined 2S2P system (with the exception of the Theta JC [RΘJC] value, which is based on a JEDEC defined 1S0P system) and will change based on environment as well as application. For more information, see these EIA/JEDEC standards:
- JESD51-2, Integrated Circuits Thermal Test Method Environmental Conditions - Natural Convection (Still Air)
- JESD51-3, Low Effective Thermal Conductivity Test Board for Leaded Surface Mount Packages
- JESD51-7, High Effective Thermal Conductivity Test Board for Leaded Surface Mount Packages
- JESD51-9, Test Boards for Area Array Surface Mount Package Thermal Measurements

8.9 Thermal Resistance Characteristics for 176-Pin PGF Package
| °C/W(1) | ||
|---|---|---|
| RΘJC | Junction-to-case thermal resistance | 9.73 |
| RΘJA | Junction-to-free air thermal resistance | 41.88 |
| PsiJT | Junction-to-package top | 0.247 |
(1) These values are based on a JEDEC defined 2S2P system (with the exception of the Theta JC [RΘJC] value, which is based on a JEDEC defined 1S0P system) and will change based on environment as well as application. For more information, see these EIA/JEDEC standards:
- JESD51-2, Integrated Circuits Thermal Test Method Environmental Conditions - Natural Convection (Still Air)
- JESD51-3, Low Effective Thermal Conductivity Test Board for Leaded Surface Mount Packages
- JESD51-7, High Effective Thermal Conductivity Test Board for Leaded Surface Mount Packages
- JESD51-9, Test Boards for Area Array Surface Mount Package Thermal Measurements
8.10 Thermal Resistance Characteristics for 128-Pin PBK Package
| °C/W(1) | ||
|---|---|---|
| RΘJC | Junction-to-case thermal resistance | 10.76 |
| RΘJA | Junction-to-free air thermal resistance | 41.65 |
| PsiJT | Junction-to-package top | 0.271 |
(1) These values are based on a JEDEC defined 2S2P system (with the exception of the Theta JC [RΘJC] value, which is based on a JEDEC defined 1S0P system) and will change based on environment as well as application. For more information, see these EIA/JEDEC standards:
- JESD51-2, Integrated Circuits Thermal Test Method Environmental Conditions - Natural Convection (Still Air)
- JESD51-3, Low Effective Thermal Conductivity Test Board for Leaded Surface Mount Packages
- JESD51-7, High Effective Thermal Conductivity Test Board for Leaded Surface Mount Packages
- JESD51-9, Test Boards for Area Array Surface Mount Package Thermal Measurements
8.11 Thermal Design Considerations
Based on the end application design and operational profile, the IDD and IDDIO currents could vary. Systems that exceed the recommended maximum power dissipation in the end product may require additional thermal enhancements. Ambient temperature (TA) varies with the end application and product design. The critical factor that affects reliability and functionality is TJ, the junction temperature, not the ambient temperature. Hence, care should be taken to keep TJ within the specified limits. Tcase should be measured to estimate the operating junction temperature TJ. Tcase is normally measured at the center of the package top-side surface. The thermal application report Semiconductor and IC Package Thermal Metrics helps to understand the thermal metrics and definitions.
8.12 Timing and Switching Characteristics
8.12.1 Timing Parameter Symbology
Timing parameter symbols used are created in accordance with JEDEC Standard 100. To shorten the symbols, some of the pin names and other related terminology have been abbreviated as follows:
| Lowercase subscripts and their meanings: | Letters and symbols and their meanings: |
|---|---|
| a | access time |
| c | cycle time (period) |
| d | delay time |
| f | fall time |
| h | hold time |
| r | rise time |
| su | setup time |
| t | transition time |
| v | valid time |
| w | pulse duration (width) |
| H | High |
| L | Low |
| V | Valid |
| X | Unknown, changing, or don't care level |
| Z | High impedance |
8.12.1.1 General Notes on Timing Parameters
All output signals from the 28x devices (including XCLKOUT) are derived from an internal clock such that all output transitions for a given half-cycle occur with a minimum of skewing relative to each other.
The signal combinations shown in the following timing diagrams may not necessarily represent actual cycles. For actual cycle examples, see the appropriate cycle description section of this document.
8.12.1.2 Test Load Circuit
This test load circuit is used to measure all switching characteristics provided in this document.
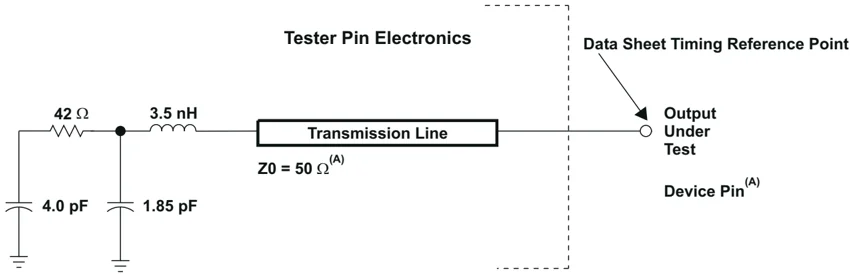
A. The data sheet provides timing at the device pin. For output timing analysis, the tester pin electronics and its transmission line effects must be taken into account. A transmission line with a delay of 2 ns or longer can be used to produce the desired transmission line effect. The transmission line is intended as a load only. It is not necessary to add or subtract the transmission line delay (2 ns or longer) from the data sheet timing. Input requirements in this data sheet are tested with an input slew rate of < 4 Volts per nanosecond (4 V/ns) at the device pin.
Figure 8-3. 3.3-V Test Load Circuit

TEXAS INSTRUMENTS www.ti.com
8.12.1.3 Signal Transition Levels
Note that some of the signals use different reference voltages, see the recommended operating conditions table. Output levels are driven to a minimum logic-high level of 2.4 V and to a maximum logic-low level of 0.4 V.
Figure 8-4 shows output levels.
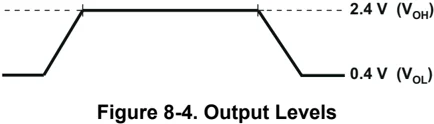
Figure 8-4. Output Levels
Output transition times are specified as follows:
- For a high-to-low transition, the level at which the output is said to be no longer high is below $V_{OH(MIN)}$ and the level at which the output is said to be low is $V_{OL(MAX)}$ and lower.
- For a low-to-high transition, the level at which the output is said to be no longer low is above $V_{OL(MAX)}$ and the level at which the output is said to be high is $V_{OH(MIN)}$ and higher.
Figure 8-5 shows the input levels.
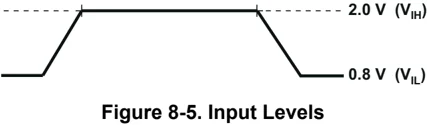
Figure 8-5. Input Levels
Input transition times are specified as follows:
- For a high-to-low transition on an input signal, the level at which the input is said to be no longer high is below $V_{IH(MIN)}$ and the level at which the input is said to be low is $V_{IL(MAX)}$ and lower.
- For a low-to-high transition on an input signal, the level at which the input is said to be no longer low is above $V_{IL(MAX)}$ and the level at which the input is said to be high is $V_{IH(MIN)}$ and higher.
Note See the individual timing diagrams for levels used for testing timing parameters.
28 Submit Document Feedback Copyright © 2021 Texas Instruments Incorporated

8.12.2 Power Supply Sequencing
TMS320F2812/F2811/F2810 silicon requires dual voltages (1.8-V or 1.9-V and 3.3-V) to power up the CPU, Flash, ADC, and the I/Os. To ensure the correct reset state for all modules during power up, there are some requirements to be met while powering up/powering down the device.
-
Option 1: In this approach, an external power sequencing circuit enables VDDIO first, then VDD and VDD1 (1.8 V or 1.9 V). After 1.8 V (or 1.9 V) ramps, the 3.3 V for Flash (VDD3VFL) and ADC (VDDA1/VDDA2/AVDDREFBG) modules are ramped up. While option 1 is still valid, TI has simplified the requirement. Option 2 is the recommended approach.
-
Option 2: Enable power to all 3.3-V supply pins (VDDIO, VDD3VFL, VDDA1/VDDA2/VDDAIO/AVDDREFBG) and then ramp 1.8 V (or 1.9 V) (VDD/VDD1) supply pins.
1.8 V or 1.9 V (VDD/VDD1) should not reach 0.3 V until VDDIO has reached 2.5 V. This ensures the reset signal from the I/O pin has propagated through the I/O buffer to provide power-on reset to all the modules inside the device. See Figure 8-7 for power-on reset timing.
-
Power-Down Sequencing: During power-down, the device reset should be asserted low (8 μs, minimum) before the VDD supply reaches 1.5 V. This will help to keep on-chip flash logic in reset prior to the VDDIO/VDD power supplies ramping down. It is recommended that the device reset control from “Low-Dropout (LDO)” regulators or voltage supervisors be used to meet this constraint. LDO regulators that facilitate power-sequencing (with the aid of additional external components) may be used to meet the power sequencing requirement. See www.spectrumdigital.com for F2812 eZdsp™ schematics and updates.
Note
The GPIO pins are undefined until VDD = 1 V and VDDIO = 2.5 V.

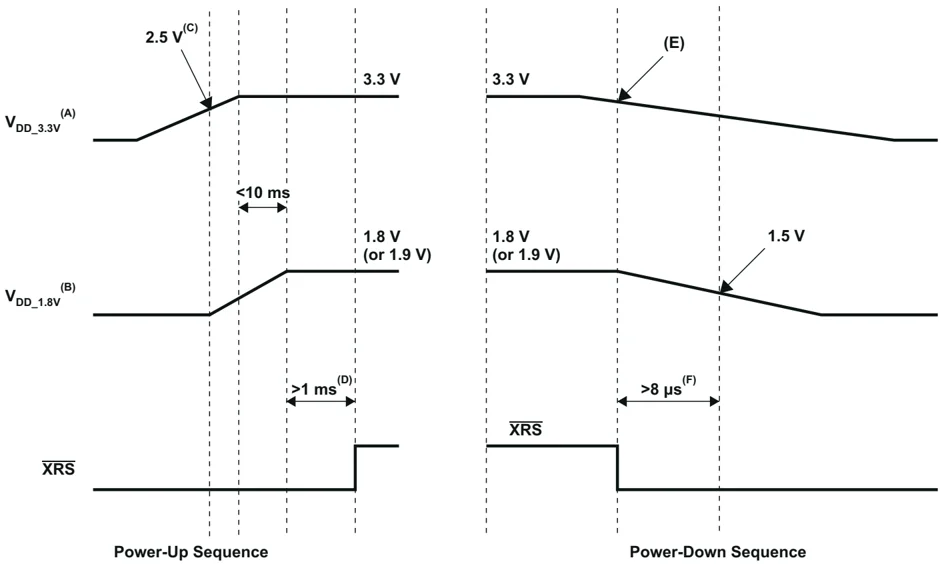
Power-Up Sequence Power-Down Sequence
A. VDD_3.3V – VDDIO, VDD3VFL, VDDAIO, VDDA1, VDDA2, AVDDREFBG B. VDD_1.8V – VDD, VDD1 C. 1.8-V (or 1.9-V) supply should ramp after the 3.3-V supply reaches at least 2.5 V. D. Reset (XRS) should remain low until supplies and clocks are stable. See Figure 8-7, Power-on Reset in Microcomputer Mode (XMP/ MC = 0), for minimum requirements. E. Voltage supervisor or LDO reset control will trip reset (XRS) first when the 3.3-V supply is off regulation. Typically, this occurs a few milliseconds before the 1.8-V (or 1.9-V) supply reaches 1.5 V. F. Keeping reset low (XRS) at least 8 μs prior to the 1.8-V (or 1.9-V) supply reaching 1.5 V will keep the flash module in complete reset before the supplies ramp down. G. Since the state of GPIO pins is undefined until the 1.8-V (or 1.9-V) supply reaches at least 1 V, this supply should be ramped as quickly as possible (after the 3.3-V supply reaches at least 2.5 V). H. Other than the power supply pins, no pin should be driven before the 3.3-V rail has been fully powered up.
Figure 8-6. F2812/F2811/F2810 Typical Power-Up and Power-Down Sequence – Option 2
30 Submit Document Feedback Copyright © 2021 Texas Instruments Incorporated
8.12.3 Reset Timing
8.12.3.1 Reset (\overlineXRS) Timing Requirements
| MIN(1) | NOM | MAX | UNIT | ||
|---|---|---|---|---|---|
| tw(RSL1) | Pulse duration, stable XCLKIN to \overlineXRS high | 8tc(Cl) | cycles | ||
| tw(RSL2) | Pulse duration, \overlineXRS low | Warm reset | 8tc(Cl) | cycles | |
| tw(WDRS) | Pulse duration, reset pulse generated by watchdog | 512tc(Cl) | cycles | ||
| td(EX) | Delay time, address/data valid after \overlineXRS high | 32tc(Cl) | cycles | ||
| tOSCST (2) | Oscillator start-up time | 1 | 10 | ms | |
| tsu(XPLLDIS) | Setup time for XPLLDIS pin | 16tc(Cl) | cycles | ||
| th(XPLLDIS) | Hold time for XPLLDIS pin | 16tc(Cl) | cycles | ||
| th(XMP/MC) | Hold time for XMP/MC pin | 16tc(Cl) | cycles | ||
| th(boot-mode) | Hold time for boot-mode pins | 2520tc(Cl) (3) | cycles |
(1) If external oscillator/clock source are used, reset time has to be low at least for 1 ms after VDD reaches 1.5 V.
(2) Dependent on crystal/resonator and board design.
(3) The boot ROM reads the password locations. Therefore, this timing requirement includes the wakeup time for flash. See the TMS320x281x DSP Boot ROM Reference Guide and the TMS320x281x DSP System Control and Interrupts Reference Guide for further information.
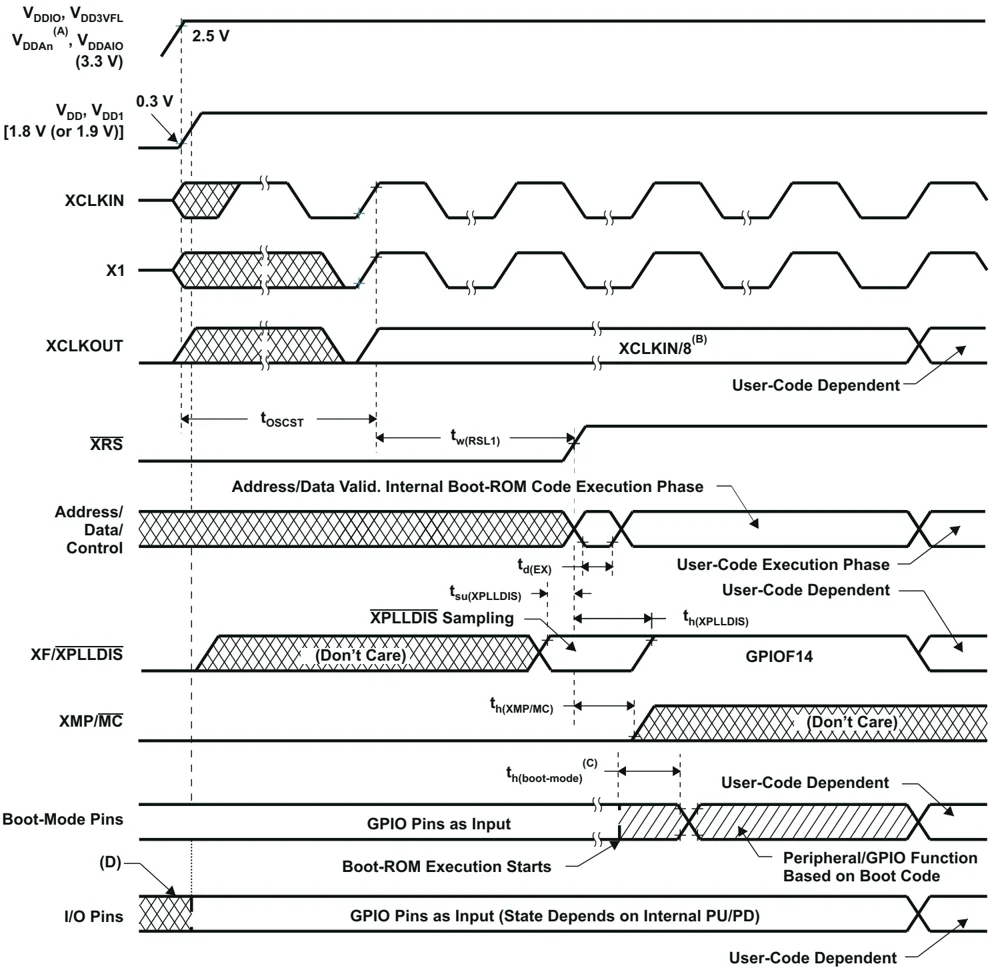
A. VDDAn – VDDA1/VDDA2 and AVDDREFBG
B. Upon power up, SYSCLKOUT is XCLKIN/2 if the PLL is enabled. Since both the XTIMCLK and CLKMODE bits in the XINTCNF2 register come up with a reset state of 1, SYSCLKOUT is further divided by 4 before it appears at XCLKOUT. This explains why XCLKOUT = XCLKIN/8 during this phase.
C. After reset, the Boot ROM code executes instructions for 1260 SYSCLKOUT cycles (SYSCLKOUT = XCLKIN/2) and then samples BOOT Mode pins. Based on the status of the Boot Mode pin, the boot code branches to destination memory or boot code function in ROM. The BOOT Mode pins should be held high/low for at least 2520 XCLKIN cycles from boot ROM execution time for proper selection of Boot modes. If Boot ROM code executes after power-on conditions (in debugger environment), the Boot code execution time is based on the current SYSCLKOUT speed. The SYSCLKOUT will be based on user environment and could be with or without PLL enabled.
D. The state of the GPIO pins is undefined (that is, they could be input or output) until the 1.8-V (or 1.9-V) supply reaches at least 1 V and 3.3-V supply reaches 2.5 V.
Figure 8-7. Power-on Reset in Microcomputer Mode (XMP/ MC = 0) (See Note D)
TMS320F2810, TMS320F2810-Q1, TMS320F2811, TMS320F2811-Q1
TMS320F2812, TMS320F2812-Q1
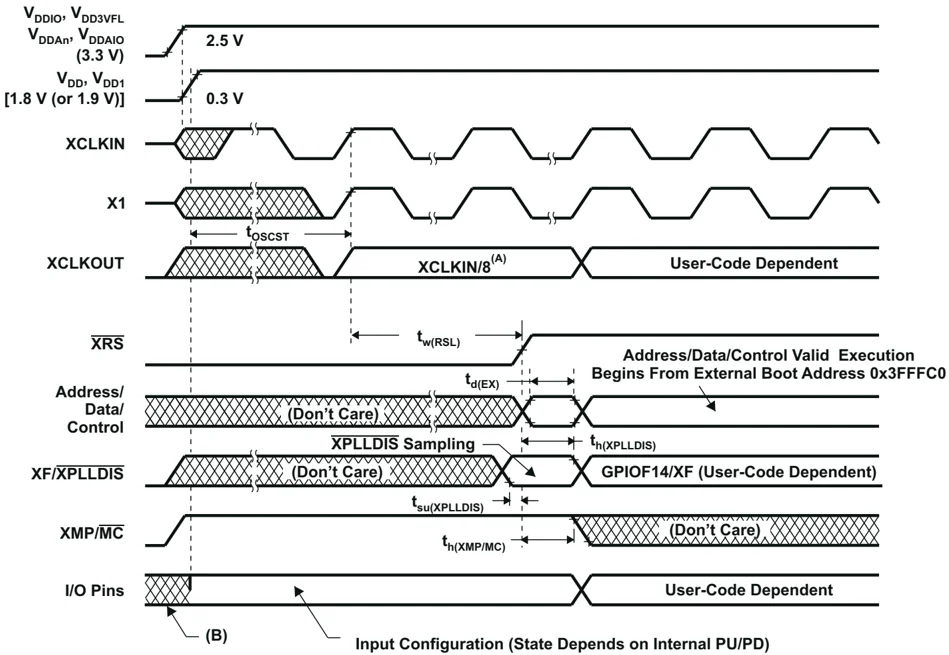
A. Upon power up, SYSCLKOUT is XCLKIN/2 if the PLL is enabled. Since both the XTIMCLK and CLKMODE bits in the XINTCNF2 register come up with a reset state of 1, SYSCLKOUT is further divided by 4 before it appears at XCLKOUT. This explains why XCLKOUT = XCLKIN/8 during this phase.
B. The state of the GPIO pins is undefined (that is, they could be input or output) until the 1.8-V (or 1.9-V) supply reaches at least 1 V and 3.3-V supply reaches 2.5 V.
Figure 8-8. Power-on Reset in Microprocessor Mode (XMP/ \overlineMC = 1)
Submit Document Feedback 33
A. After reset, the Boot ROM code executes instructions for 1260 SYSCLKOUT cycles (SYSCLKOUT = XCLKIN/2) and then samples BOOT Mode pins. Based on the status of the Boot Mode pin, the boot code branches to destination memory or boot code function in ROM. The BOOT Mode pins should be held high/low for at least 2520 XCLKIN cycles from boot ROM execution time for proper selection of Boot modes. If Boot ROM code executes after power-on conditions (in debugger environment), the Boot code execution time is based on the current SYSCLKOUT speed. The SYSCLKOUT will be based on user environment and could be with or without PLL enabled.
Figure 8-9. Warm Reset in Microcomputer Mode
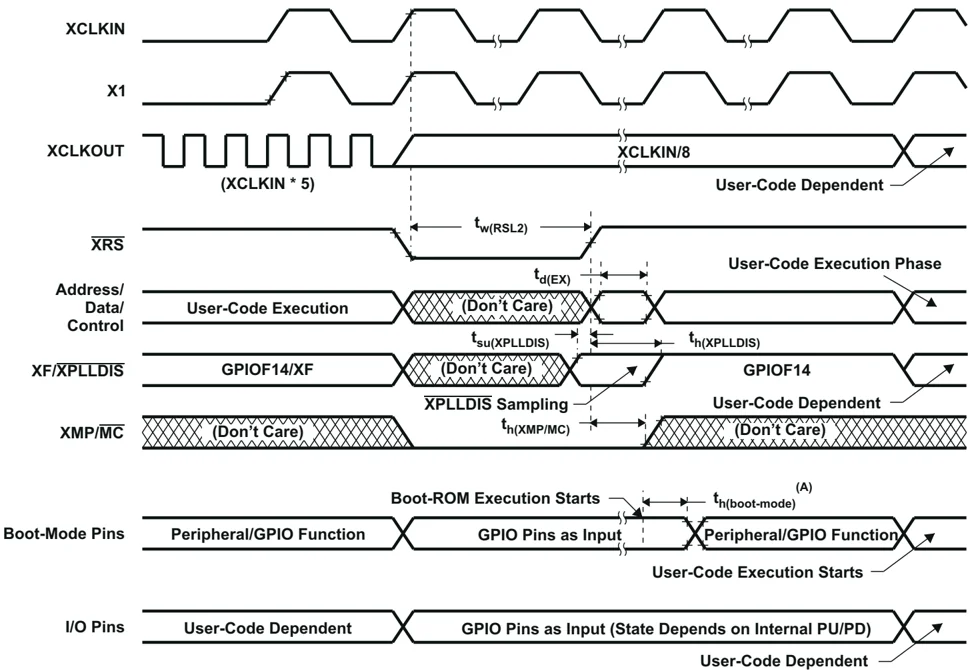
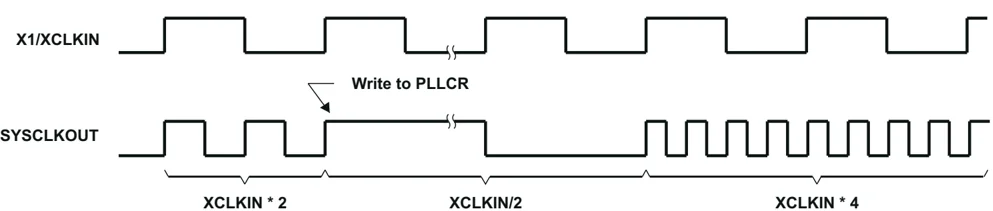
Figure 8-10. Effect of Writing Into PLLCR Register
34 Submit Document Feedback Copyright © 2021 Texas Instruments Incorporated

8.12.4 Clock Specifications
8.12.4.1 Device Clock Table
This section provides the timing requirements and switching characteristics for the various clock options available on the F281x DSPs. Section 8.12.4.1.1 lists the cycle times of various clocks.
8.12.4.1.1 Clock Table and Nomenclature
| MIN | NOM | MAX | UNIT | ||
|---|---|---|---|---|---|
| On chip oscillator clock | tc(OSC), Cycle time | 28.6 | 50 | ns | |
| Frequency | 20 | 35 | MHz | ||
| XCLKIN | tc(CI), Cycle time | 6.67 | 250 | ns | |
| Frequency | 4 | 150 | MHz | ||
| SYSCLKOUT | tc(SCO), Cycle time | 6.67 | 500 | ns | |
| Frequency | 2 | 150 | MHz | ||
| XCLKOUT | tc(XCO), Cycle time | 6.67 | 2000 | ns | |
| Frequency | 0.5 | 150 | MHz | ||
| HSPCLK | tc(HCO), Cycle time | 6.67 | 13.3(1) | ns | |
| Frequency | 75(1) | 150 | MHz | ||
| LSPCLK | tc(LCO), Cycle time | 13.3 | 26.6(1) | ns | |
| Frequency | 37.5(1) | 75 | MHz | ||
| ADC clock | tc(ADCCLK), Cycle time(2) | 40 | ns | ||
| Frequency | 25 | MHz | |||
| SPI clock | tc(SPC), Cycle time | 50 | ns | ||
| Frequency | 20 | MHz | |||
| McBSP | tc(CKG), Cycle time | 50 | ns | ||
| Frequency | 20 | MHz | |||
| XTIMCLK | tc(XTIM), Cycle time | 6.67 | ns | ||
| Frequency | 150 | MHz |
(1) This is the default reset value if SYSCLKOUT = 150 MHz.
(2) The maximum value for ADCCLK frequency is 25 MHz. For SYSCLKOUT values of 25 MHz or lower, ADCCLK has to be SYSCLKOUT/2 or lower. ADCCLK = SYSCLKOUT is not a valid mode for any value of SYSCLKOUT.
8.12.4.2 Clock Requirements and Characteristics
8.12.4.2.1 Input Clock Requirements
The clock provided at the XCLKIN pin generates the internal CPU clock cycle.
8.12.4.2.1.1 Input Clock Frequency
| PARAMETER | MIN | TYP | MAX | UNIT | ||
|---|---|---|---|---|---|---|
| fx Input clock frequency | Resonator | 20 | 35 | MHz | ||
| Crystal | 20 | 35 | ||||
| XCLKIN | Without PLL | 4 | 150 | |||
| With PLL | 5 | 100 | ||||
| fl Limp mode clock frequency | 2 | MHz |
8.12.4.2.1.2 XCLKIN Timing Requirements – PLL Bypassed or Enabled
| NO. | MIN | MAX | UNIT | ||
|---|---|---|---|---|---|
| C8 | tc(CI) | Cycle time, XCLKIN | 6.67 | 250 | ns |
| C9 | tf(CI) | Fall time, XCLKIN | 6 | ns | |
| C10 | tr(CI) | Rise time, XCLKIN | 6 | ns | |
| C11 | tw(CIL) | Pulse duration, X1/XCLKIN low as a percentage of tc(CI) | 40 | 60 | % |
| C12 | tw(CIH) | Pulse duration, X1/XCLKIN high as a percentage of tc(CI) | 40 | 60 | % |
8.12.4.2.1.3 XCLKIN Timing Requirements – PLL Disabled
| NO. | MIN | MAX | UNIT | |||
|---|---|---|---|---|---|---|
| C8 | tc(CI) | Cycle time, XCLKIN | 6.67 | 250 | ns | |
| C9 | tf(CI) | Fall time, XCLKIN | Up to 30 MHz | 6 | ns | |
| 30 MHz to 150 MHz | 2 | |||||
| C10 | tr(CI) | Rise time, XCLKIN | Up to 30 MHz | 6 | ns | |
| 30 MHz to 150 MHz | 2 | |||||
| C11 | tw(CIL) | Pulse duration, X1/XCLKIN low as a percentage of tc(CI) | XCLKIN ≤ 120 MHz | 40 | 60 | % |
| 120 < XCLKIN ≤ 150 MHz | 45 | 55 | ||||
| C12 | tw(CIH) | Pulse duration, X1/XCLKIN high as a percentage of tc(CI) | XCLKIN ≤ 120 MHz | 40 | 60 | % |
| 120 < XCLKIN ≤ 150 MHz | 45 | 55 |
Table 8-2. Possible PLL Configuration Modes
| PLL MODE | REMARKS | SYSCLKOUT |
|---|---|---|
| PLL Disabled | Invoked by tying XPLLDIS pin low upon reset. PLL block is completely disabled. Clock input to the CPU (CLKIN) is directly derived from the clock signal present at the X1/XCLKIN pin. | XCLKIN |
| PLL Bypassed | Default PLL configuration upon power-up, if PLL is not disabled. The PLL itself is bypassed. However, the /2 module in the PLL block divides the clock input at the X1/XCLKIN pin by two before feeding it to the CPU. | XCLKIN/2 |
| PLL Enabled | Achieved by writing a non-zero value “n” into PLLCR register. The /2 module in the PLL block now divides the output of the PLL by two before feeding it to the CPU. | (XCLKIN * n) / 2 |

8.12.4.2.2 Output Clock Characteristics
8.12.4.2.2.1 XCLKOUT Switching Characteristics (PLL Bypassed or Enabled)
| NO.(1) (2) | PARAMETER | MIN | TYP | MAX | UNIT |
|---|---|---|---|---|---|
| C1 | tc(XCO) Cycle time, XCLKOUT | 6.67(3) | ns | ||
| C3 | tf(XCO) Fall time, XCLKOUT | 2 | ns | ||
| C4 | tr(XCO) Rise time, XCLKOUT | 2 | ns | ||
| C5 | tw(XCOL) Pulse duration, XCLKOUT low | H – 2 | H + 2 | ns | |
| C6 | tw(XCOH) Pulse duration, XCLKOUT high | H – 2 | H + 2 | ns | |
| C7 | tp PLL lock time(4) | 131072tc(Cl) | ns |
(1) A load of 40 pF is assumed for these parameters.
(2) H = 0.5tc(XCO)
(3) The PLL must be used for maximum frequency operation.
(4) This parameter has changed from 4096 XCLKIN cycles in the earlier revisions of the silicon.
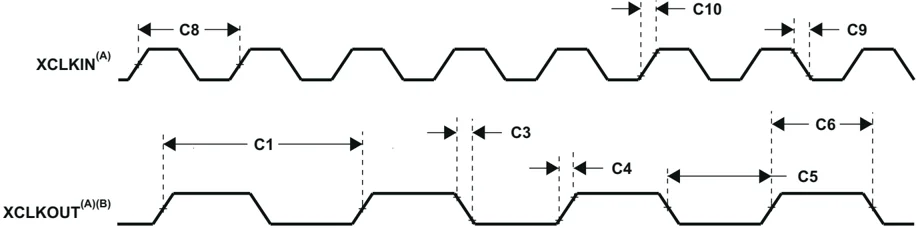
A. The relationship of XCLKIN to XCLKOUT depends on the divide factor chosen. The waveform relationship shown in Figure 8-11 is intended to illustrate the timing parameters only and may differ based on configuration.
B. XCLKOUT configured to reflect SYSCLKOUT.
Figure 8-11. Clock Timing

8.12.5 Peripherals
8.12.5.1 General-Purpose Input/Output (GPIO) – Output Timing
8.12.5.1.1 General-Purpose Output Switching Characteristics
| PARAMETER | MIN | MAX | UNIT |
|---|---|---|---|
| td(XCOH-GPO) Delay time, XCLKOUT high to GPIO low/high | All GPIOs | 1tc(SCO) | cycle |
| tr(GPO) Rise time, GPIO switching low to high | All GPIOs | 10 | ns |
| tf(GPO) Fall time, GPIO switching high to low | All GPIOs | 10 | ns |
| fGPO Toggling frequency, GPO pins | 20 | MHz |
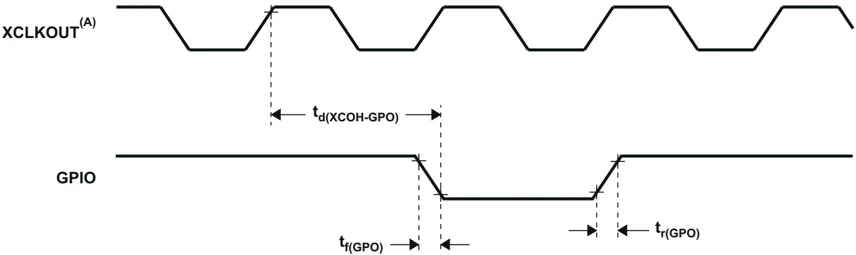
A. XCLKOUT = SYSCLKOUT
Figure 8-12. General-Purpose Output Timing
38 Submit Document Feedback Copyright © 2021 Texas Instruments Incorporated Product Folder Links: TMS320F2810 TMS320F2810-Q1 TMS320F2811 TMS320F2811-Q1 TMS320F2812 TMS320F2812-Q1
8.12.5.2 General-Purpose Input/Output (GPIO) – Input Timing
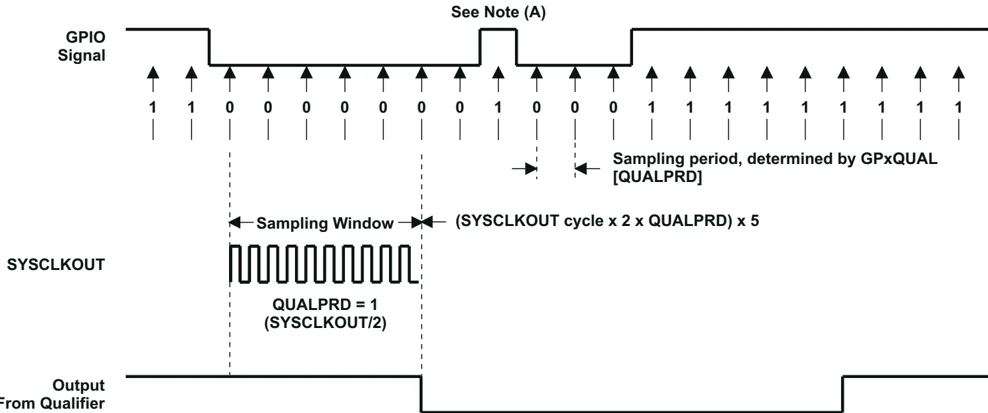
A. This glitch is ignored by the input qualifier. The QUALPRD bit field specifies the qualification sampling period. It can vary from 00 to 0xFF. Input qualification is not applicable when QUALPRD = 00. For any other value “n”, the qualification sampling period is 2n SYSCLKOUT cycles (that is, at every 2n SYSCLKOUT cycle, the GPIO pin will be sampled). Six consecutive samples must be of the same value for a given input to be recognized.
B. For the qualifier to detect the change, the input must be stable for 10 SYSCLKOUT cycles or greater. In other words, the inputs should be stable for (5 × QUALPRD × 2) SYSCLKOUT cycles. This would enable five sampling periods for detection to occur. Since external signals are driven asynchronously, a 13-SYSCLKOUT-wide pulse provides reliable recognition.
Figure 8-13. GPIO Input Qualifier – Example Diagram for QUALPRD = 1
TEXAS INSTRUMENTS www.ti.com
8.12.5.2.1 General-Purpose Input Timing Requirements
(1) Input Qualification Time (IQT) = [tc(SCO) × 2 × QUALPRD] × 5 + [tc(SCO) × 2 × QUALPRD].
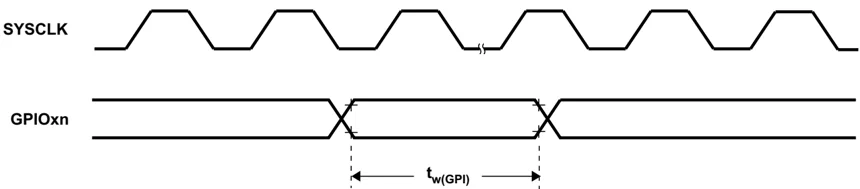
Figure 8-14. General-Purpose Input Timing
Note
The pulse width requirement for general-purpose input is applicable for the \overlineXBIO and ADCSOC pins as well.
Product Folder Links: TMS320F2810 TMS320F2810-Q1 TMS320F2811 TMS320F2811-Q1 TMS320F2812 TMS320F2812-Q1
8.12.5.3 Event Manager Interface
8.12.5.3.1 PWM Timing
PWM refers to all PWM outputs on EVA and EVB.
8.12.5.3.1.1 PWM Switching Characteristics
| PARAMETER(1) (2) | TEST CONDITIONS | MIN | MAX | UNIT | |
|---|---|---|---|---|---|
| tw(PWM) (3) | Pulse duration, PWMx output high/low | 25 | ns | ||
| td(PWM)XCO | Delay time, XCLKOUT high to PWMx output switching | XCLKOUT = SYSCLKOUT/4 | 10 | ns |
(1) See the GPIO output timing for fall/rise times for PWM pins.
(2) PWM pin toggling frequency is limited by the GPIO output buffer switching frequency (20 MHz).
(3) PWM outputs may be 100%, 0%, or increments of tc(HCO) with respect to the PWM period.
8.12.5.3.1.2 Timer and Capture Unit Timing Requirements
| PARAMETER | TEST CONDITIONS | MIN | MAX(2) (1) | UNIT | |
|---|---|---|---|---|---|
| tw(TDIR) | Pulse duration, TDIRx low/high | Without input qualifier | 2tc(sco) | cycles | |
| With input qualifier | 1tc(sco) + IQT(3) | ||||
| tw(CAP) | Pulse duration, CAPx input low/high | Without input qualifier | 2tc(sco) | cycles | |
| With input qualifier | 1tc(sco) + IQT(3) | ||||
| tw(TCLKINL) | Pulse duration, TCLKINx low as a percentage of TCLKINx cycle time | 40 | 60 | % | |
| tw(TCLKINH) | Pulse duration, TCLKINx high as a percentage of TCLKINx cycle time | 40 | 60 | % | |
| tc(TCLKIN) | Cycle time, TCLKINx | 4tc(HCO) | ns |
(1) The QUALPRD bit field value can range from 0 (no qualification) through 0xFF (510 SYSCLKOUT cycles). The qualification sampling period is 2n SYSCLKOUT cycles, where “n” is the value stored in the QUALPRD bit field. As an example, when QUALPRD = 1, the qualification sampling period is 1 × 2 = 2 SYSCLKOUT cycles (that is, the input is sampled every 2 SYSCLKOUT cycles). Six such samples will be taken over five sampling windows, each window being 2n SYSCLKOUT cycles. For QUALPRD = 1, the minimum width that is needed is 5 × 2 = 10 SYSCLKOUT cycles. However, since the external signal is driven asynchronously, a 11-SYSCLKOUT-wide pulse ensures reliable recognition.
(2) Maximum input frequency to the QEP = min[HSPCLK/2, 20 MHz]
(3) Input Qualification Time (IQT) = [tc(sco) × 2 × QUALPRD] × 5 + [tc(sco) × 2 × QUALPRD].
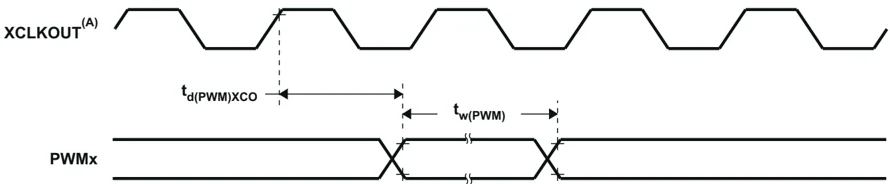
Figure 8-15. PWM Output Timing

Figure 8-16. TDIRx Timing

8.12.5.3.1.3 External ADC Start-of-Conversion – EVA – Switching Characteristics
| PARAMETER(1) | MIN | MAX | UNIT |
|---|---|---|---|
| td(XCOH-EVASOCL) Delay time, XCLKOUT high to EVASOC low | 1tc(SCO) | cycle | |
| tw(EVASOCL) Pulse duration, EVASOC low | 32tc(HCO) | ns |
(1) XCLKOUT = SYSCLKOUT

Figure 8-17. EVASOC Timing
8.12.5.3.1.4 External ADC Start-of-Conversion – EVB – Switching Characteristics
| PARAMETER(1) | MIN | MAX | UNIT |
|---|---|---|---|
| td(XCOH-EVBSOCL) Delay time, XCLKOUT high to EVBSOC low | 1tc(SCO) | cycle | |
| tw(EVBSOCL) Pulse duration, EVBSOC low | 32tc(HCO) | ns |
(1) XCLKOUT = SYSCLKOUT

Figure 8-18. EVBSOC Timing

8.12.5.4 Low-Power Mode Wakeup Timing
8.12.5.4.1 IDLE Mode Timing Requirements
| MIN | MAX | UNIT | ||
|---|---|---|---|---|
| tW(WAKE-INT) Pulse duration, external wake-up signal | Without input qualifier | 2tc(SCO) | cycles | |
| With input qualifier | 1tc(SCO) + IQT(1) |
(1) Input Qualification Time (IQT) = [tc(SCO) × 2 × QUALPRD] × 5 + [tc(SCO) × 2 × QUALPRD].
8.12.5.4.2 IDLE Mode Switching Characteristics
| PARAMETER | TEST CONDITIONS | MIN | MAX | UNIT |
|---|---|---|---|---|
| td(WAKE-IDLE) Delay time, external wake signal to program execution resume(1) | ||||
| • Wake-up from Flash– Flash module in active state | Without input qualifier | 8tc(SCO) | cycles | |
| With input qualifier | 8tc(SCO) + IQT(2) | |||
| • Wake-up from Flash– Flash module in sleep state | Without input qualifier | 1050tc(SCO) | cycles | |
| With input qualifier | 1050tc(SCO) + IQT(2) | |||
| • Wake-up from SARAM | Without input qualifier | 8tc(SCO) | cycles | |
| With input qualifier | 8tc(SCO) + IQT(2) |
(1) This is the time taken to begin execution of the instruction that immediately follows the IDLE instruction. Execution of an ISR (triggered by the wake-up) signal involves additional latency.
(2) Input Qualification Time (IQT) = [tc(SCO) × 2 × QUALPRD] × 5 + [tc(SCO) × 2 × QUALPRD].

A. XCLKOUT = SYSCLKOUT
B. WAKE INT can be any enabled interrupt, WDINT, XNMI, or XRS.
Figure 8-19. IDLE Entry and Exit Timing