10 Voltage Measurement Parameters
Figure 2- 123 Table 2- 78 The Voltage Measurements menu (Page 1/3)
 \begin{tabular}{|l|l|l|}
\hline
\textbf{Menu} & \textbf{Settings} & \textbf{Comments} \
\hline
Vmax & & Measure maximum voltage of a waveform \
\hline
Vmin & & Measure minimum voltage of a waveform \
\hline
Vpp & & Measure Peak-to-Peak Voltage \
\hline
Vtop & & Measure a flat top voltage of a square waveform \
\hline
\end{tabular}
Figure 2- 124 Table 2- 79 The Voltage Measurements menu (Page 2/3)
 \begin{tabular}{|l|l|l|}
\hline
\textbf{Menu} & \textbf{Settings} & \textbf{Comments} \
\hline
Vbase & & Measure a flat base voltage of a square waveform \
\hline
Vamp & & Measure voltage between Vtop and Vbase \
\hline
Vavg & & Measure average voltage of a waveform \
\hline
Vrms & & Measure Root Mean Square Voltage of a waveform \
\hline
\end{tabular}
Figure 2- 125 Table 2- 80 The Voltage Measurements menu (Page 3/3)
 \begin{tabular}{|l|l|l|}
\hline
\textbf{Menu} & \textbf{Settings} & \textbf{Comments} \
\hline
Overshoot & & Measure overshoot in percentage of an edge \
\hline
Preshoot & & Measure preshoot in percentage of an edge \
\hline
\end{tabular}
10 Time Measurement Parameters
Figure 2- 126 Table 2- 81 The Time Measurements menu (Page 1/4)
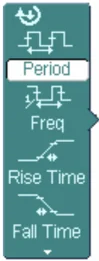
Figure 2- 127 Table 2- 82 The Time Measurements menu (Page 2/4)
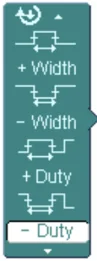
Figure 2- 128 Table 2- 83 The Time Measurements menu (Page 3/4)
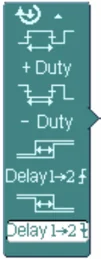
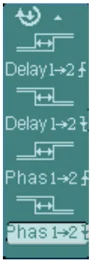
Figure 2-129 Table 2-84 The Time Measurements menu (Page 4/4)
| Menu | Settings | Comments |
|---|---|---|
| Phas1→2↑ | Measure the phase deviation between two channels at the rising edge | |
| Phas1→2↓ | Measure the phase deviation between two channels at the falling edge |
NOTE: The results of the automatic measurements will be displayed on the bottom of the screen. Maximum 3 results could be displayed at the same time. When there is no room, the next new measurement result will make the previous results moving left out of screen.
© 2008 RIGOL Technologies, Inc. 2-91 User’s Guide for DS1000E, DS1000D Series
Using Automatic Measurement
-
Select the signal channel for measuring. CH1 or CH2 according to the signal of interest. Press soft buttons as follows: Measure \rightarrow Source \rightarrow CH1 or CH2.
-
To see all measurement values, set the Display All to ON. 18 measurement parameters will be displayed on the screen (except for “Delay1\rightarrow2f” and “Delay1\rightarrow2t”).
-
Select parameters page for measuring; select voltage or time parameters pages by pressing soft button as follows: Measure \rightarrow Voltage or time \rightarrow Vmax, Vmin ........
-
To get the measured value on the screen; select the parameters of interest by pressing the soft button on the right of the menu, and read the data on the bottom of the screen. If the data is displayed as “*****”, it means the parameter cannot be measured in current condition.
-
Clear the measure values: press Clear and all of the auto measure values would disappear from the screen (except for “Display all” parameters).
 Measure
Source
CH1
Voltage
Time
Clear
Display All
OFF
Clear measured data from screen
Turn on/off the mass measurement
Figure 2- 130 Measurement display
The automatic measurement of voltage parameters
The oscilloscope provides automatic voltage measurements including Vpp, Vmax, Vmin, Vavg, Vamp, Vrms, Vtop, Vbase, Overshoot and Preshoot. Figure below shows a pulse with some of the voltage measurement points.
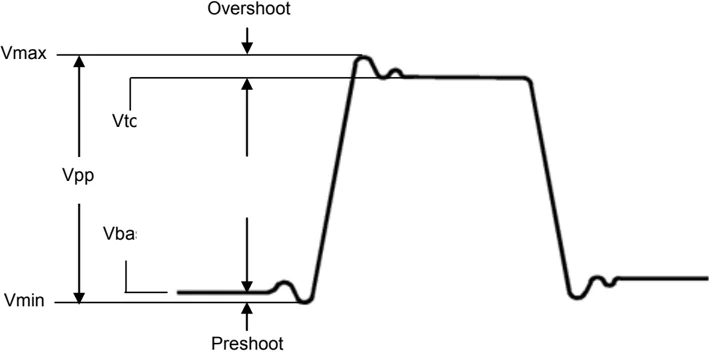
Figure 2- 131 Voltage parameters
Vpp: Peak-to-Peak Voltage. Vmax: The maximum amplitude. The most positive peak voltage measured over the entire waveform. Vmin: The minimum amplitude. The most negative peak voltage measured over the entire waveform. Vamp: Voltage between Vtop and Vbase of a waveform Vtop: Voltage of the waveform's flat top, useful for square/pulse waveforms. Vbase: Voltage of the waveform's flat base, useful for square/pulse waveforms. Overshoot: Defined as (Vmax-Vtop)/Vamp, useful for square and pulse waveforms. Preshoot: Defined as (Vmin-Vbase)/Vamp, useful for square and pulse waveforms. Average: The arithmetic mean over the entire waveform. Vrms: The true Root Mean Square voltage over the entire waveform.
The automatic measurement of time parameters
The oscilloscope provides time parameters auto-measurements include Frequency, Period, Rise Time, Fall Time, +Width, -Width, Delay 1→2f , Delay 1→2t, Phas 1 →2f, Phas 1→2t, +Duty and -Duty. The following figure shows a pulse with some of the time measurement points.
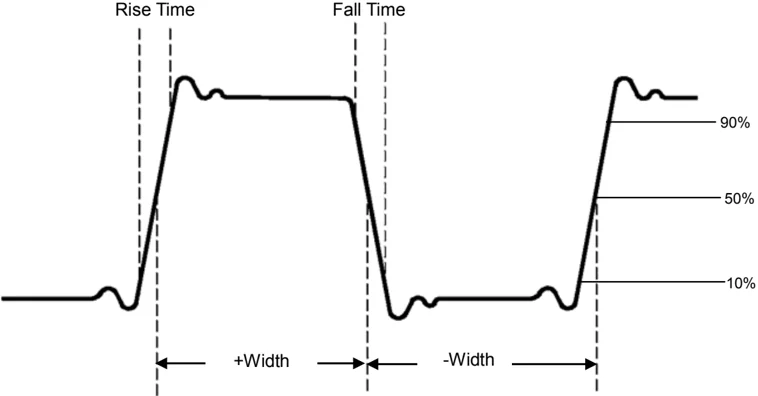
Figure 2- 132 Time parameters
Rise Time: Time that the leading edge of the first pulse in the waveform takes to rise from 10% to 90% of its amplitude. Fall Time: Time that the falling edge of the first pulse in the waveform takes to fall from 90% to 10% of its amplitude. +Width: The width of the first positive pulse in 50% amplitude points. -Width: The width of the first negative pulse in the 50% amplitude points. Delay 1→2f: The delay between the two channels at the rising edge. Delay 1→2t: The delay between the two channels at the falling edge. Phas 1→2f: The phase deviation between the two channels at the rising edge. Phas 1→2t: The phase deviation between the two channels at the falling edge. +Duty: +Duty Cycle, defined as +Width/Period -Duty: -Duty Cycle, defined as -Width/Period
2-94 © 2008 RIGOL Technologies, Inc.
To Measure with Cursors
Figure displays the Cursor button on the front-panel.
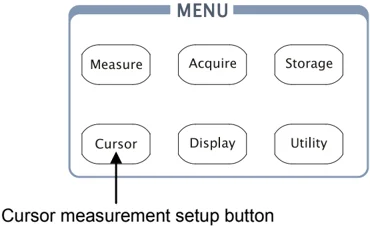
Cursor measurement setup button
Figure 2- 133 Cursor measurement setup button
The cursor measurement has three modes: Manual, Track and Auto Measure.
1. Manual Mode:
In this mode, the screen displays two parallel cursors. Move the cursors to make custom voltage or time measurements of the signal. The values are displayed on the boxes below the menu. Before using cursors, make sure to set the Signal Source as the channel for measuring.
2. Track Mode:
In this mode, the screen displays two cross cursors. The cross cursor sets the position on the waveform automatically. Adjust cursor's horizontal position on the waveform by rotating the multifunctional knob ( ). The oscilloscope displays the values of the coordinates on the boxes below the menu.
3. Auto Mode:
This mode will take effect with Automatic Measurements. The instruments will display cursors while measuring parameters automatically. These cursors demonstrate the electrical meanings of these measurements.
NOTE: The Auto Measure mode for Cursor measuring will take no effect without automatic measurements.
Manual Mode
Press \boxedCursor \rightarrow Mode \rightarrow Manual to display the manual mode menu.
Figure 2- 134 Table 2- 85 The Manual Mode Menu
In this mode, the oscilloscope measures the Y or X coordinate values of the cursors, and the increments between the two cursors.
When the cursor is in X type, a pair of vertical cursors CurA and CurB will be appeared in the screen, whose time value could be measured separately as well as the time difference between them, and which will be changed with the location of cursor if you twirl the knob .
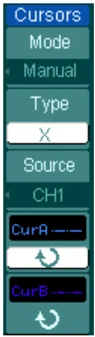
Figure 2- 135 Manual Measure Mode of Cursor Measurement
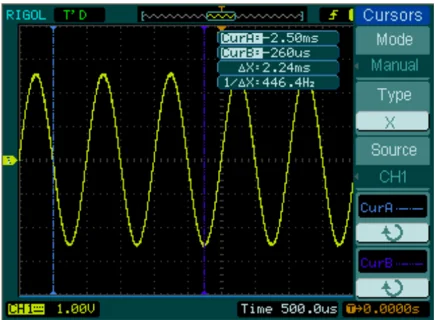
When the cursor is in Y type, a pair of horizontal cursors CurA and CurB will be appeared in the screen, whose voltage value could be measured separately as well as the voltage difference between them, and which will be changed with the location of cursor if you twirl the knob (icon).
To do manual Cursor Measurements, please do as the following steps:
- Select the Manual mode for cursor measurement by pressing soft button as: Cursor \rightarrow Mode \rightarrow Manual.
- Select channel Source for measurements by pressing soft button as: Cursor \rightarrow Source \rightarrow CH1, CH2, MATH (FFT) or LA (DS1000D series)
NOTE: While measuring the channel of MATH, the results are valued with "d" (division) as units.
- Select the cursors type by pressing soft button as Cursor \rightarrow Type \rightarrow X or Y.
- Move the cursors to adjust the increment between the cursors: (Details in the following Table)
Table 2- 86 The Cursor menu
\begin{tabular}{|l|c|p{7cm}|} \hline \textbf{Cursor} & \textbf{Increment} & \textbf{Operation} \ \hline \multirow{2}{}{Cursor A} & X & Turn the multifunctional knob (icon) to move cursor A horizontally \ \cline{2-3} & Y & Turn the multifunctional knob (icon) to move cursor A vertically \ \hline \multirow{2}{}{Cursor B} & X & Turn the multifunctional knob (icon) to move cursor B horizontally \ \cline{2-3} & Y & Turn the multifunctional knob (icon) to move cursor B vertically \ \hline \end{tabular}
NOTE: Cursor could be moved only when the curse function menu is displayed.
- To get measurement values: Position of Cursor A (time cursor centered on the midpoint of screen; Voltage cursor centered on channel ground level). Position of Cursor B (same as above). Horizontal space between cursor A and B (\DeltaX): Time between cursors (1/\DeltaX), units in Hz, kHz, MHz, GHz.
Vertical space between cursor A and B (\DeltaY): Voltage between cursors
If you choose the source as LA (DS1000D series), the measurement value is as follows: Position of Cursor A (time cursor centered on the midpoint of screen). Position of Cursor B (time cursor centered on the midpoint of screen). Cursor A value: Hex. Cursor A value: Binary. Cursor B value: Hex. Cursor B value: Binary.
NOTE: The values will be automatically displayed on the right upper corner of screen when the cursor function menu is hidden or displaying other menus.
Key Points
Cursor Y: Cursors Y appear as horizontal lines on the display to measure vertical parameters. Usually it is used to measure the Volts. When the source is set as function, the units are assigned to the function.
Cursor X: Cursor X appears as vertical lines on the display to measure horizontal parameters. Usually it indicates the time of trigger excursion. When the source is set as FFT, X means frequency.
2-98 © 2008 RIGOL Technologies, Inc.
Track Mode
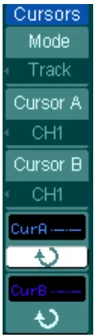
Press Cursor \rightarrow Mode \rightarrow Track to display the track mode menu.
Figure 2- 136 Table 2- 87 The Track Mode Menu
\begin{tabular}{|l|l|l|} \hline \textbf{Menu} & \textbf{Settings} & \textbf{Comments} \ \hline Mode & Track & Set Track mode in cursor measurement \ \hline Cursor A & CH1 CH2 None & Set Cursor A in conjunction with CH1, CH2 or turn off Cursor A \ \hline Cursor B & CH1 CH2 None & Set Cursor B in conjunction with CH1, CH2 or turn off Cursor B \ \hline CurA (Cursor A) & \circlearrowleft & Turn the multifunctional knob (\circlearrowleft) to move cursor A horizontally \ \hline CurB (Cursor B) & \circlearrowleft & Turn the multifunctional knob (\circlearrowleft) to move cursor B horizontally \ \hline \end{tabular}
In Track mode, the cross cursor is displayed on the waveform under measuring. If you move the horizontal position of cursor, the horizontal coordinate and vertical coordinate of current point as well as the increments of them will be displayed immediately. Note: horizontal coordinate represents time value, vertical coordinate represents voltage value.
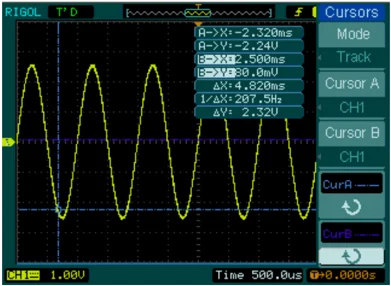
Figure 2- 137 Track Measure Mode of Cursor Measurement
© 2008 RIGOL Technologies, Inc. User's Guide for DS1000E, DS1000D Series 2-99
To do Track mode Cursor Measurements, follow these steps:
-
Select the Track mode for cursor measurement by pressing soft button as:
Cursor → Mode → Track. -
Select channel Source for Cursor A and Cursor B by pressing soft button as:
Cursor → Cursor A or Cursor B → CH1, CH2 or None. -
Move the cursors to adjust the horizontal positions of the cursors: (Details in the following Table)
Table 2-88 The Cursor usage
| Cursor | Operation |
|---|---|
| Cursor A | Turn the multifunctional knob (↻) to move cursor A horizontally |
| Cursor B | Turn the multifunctional knob (↻) to move Cursor B horizontally |
NOTE: Moving cursor horizontally is not allowed when other (not tracking cursor) menu is activated
-
To get measurement value:
-
Position of Cursor 1 (Time cursor centered on the midpoint of screen; Voltage cursor centered on channel ground level).
-
Position of Cursor 2 (Time cursor centered on the midpoint of screen; Voltage cursor centered on channel ground level).
-
Read the horizontal space between Cursor 1 and 2 (ΔX): Time between cursors, units in seconds.
-
(1/ΔX), units in Hz, kHz, MHz, GHz.
-
Vertical space between cursor 1 and 2 (ΔY): Voltage between cursors, units in V.
-
User’s Guide for DS1000E, DS1000D Series
Auto Mode
Press Cursor → Mode → Auto to display the auto mode menu.
Figure 2-138 Table 2-89 The Auto Mode Menu
| Menu | Settings | Comments |
|---|---|---|
| Mode | Auto | Display the cursors for the current automatic measuring. (See the following figure) |
There will be no cursor display if no parameters are chosen in Measure menu. The oscilloscope could move cursor automatically to measure 22 parameters in Measure menu.
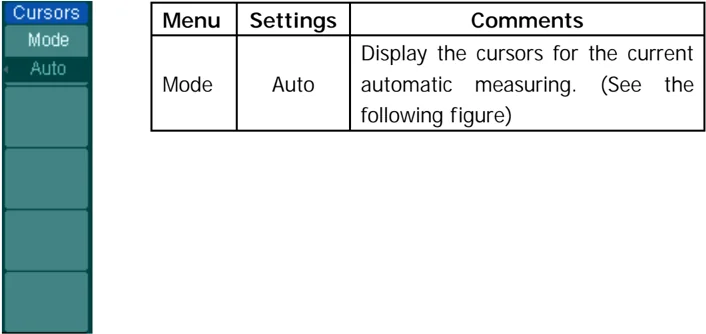
Figure 2-139
Auto Measure Mode of Cursor Measurement
User’s Guide for DS1000E, DS1000D Series
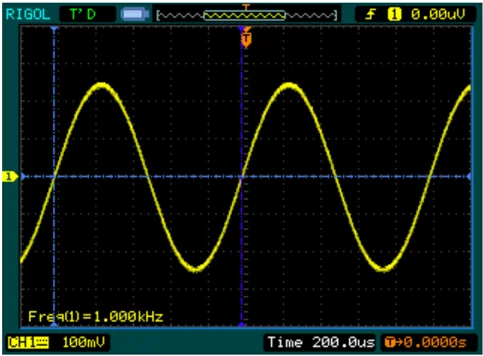
To Use Run Control Buttons
The run control buttons include AUTO (auto setting) and RUN/STOP.
Auto:
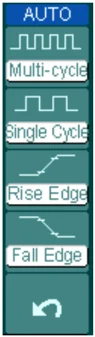
The AUTO features automatic adjustments to produce a usable display of the input signal. Press AUTO button, the following menu appears.
Figure 2- 140 Table 2- 90 The Auto menu
2-102 © 2008 RIGOL Technologies, Inc.
Auto-set functions
After the AUTO is pressed the oscilloscope is configured to the following defaults:
Table 2- 91 The Auto menu
RUN/STOP: Run or Stop waveform acquiring.
NOTE: The volts/div and horizontal time base can be adjusted in a fixed limit. That is, to zoom in/out the signal in vertical and horizontal directions.
This page is blank.